If you missed Part 1, do read it here.

India’s gold loan portfolio grew 3.8x since March 2022 to ₹16.8 lakh crore — now bigger than personal loans. Average ticket size doubled. Borrower quality appears to have improved, with Prime+ share rising from 43% to 52%. North India is the new growth frontier. The headline story looks strong. Part 2 is where it gets complicated.
Every credit cycle looks healthy in the growth phase. The NPA numbers stay low because the portfolio is young and fresh originations are diluting the bad book. The cracks appear later — in specific cohorts, specific behaviours, specific segments that the aggregate number quietly buries.
The TransUnion CIBIL report is unusual in that it does not stop at the aggregate. It digs into borrower-level behaviour patterns and maps them to forward-looking delinquency. What it finds is not reassuring. Three specific stress signals emerge clearly — and one of them shows a 9x differential in bad rates versus the portfolio average.
As someone who has spent almost a decade around teams building credit risk models — I try to spend this edition on exactly these signals. Because the patterns here rhyme with what we saw in other products before the collapse: aggregate improvement hiding concentrated tail risk in borrowers who are overleveraged and running out of options.
The Three Stress Signals
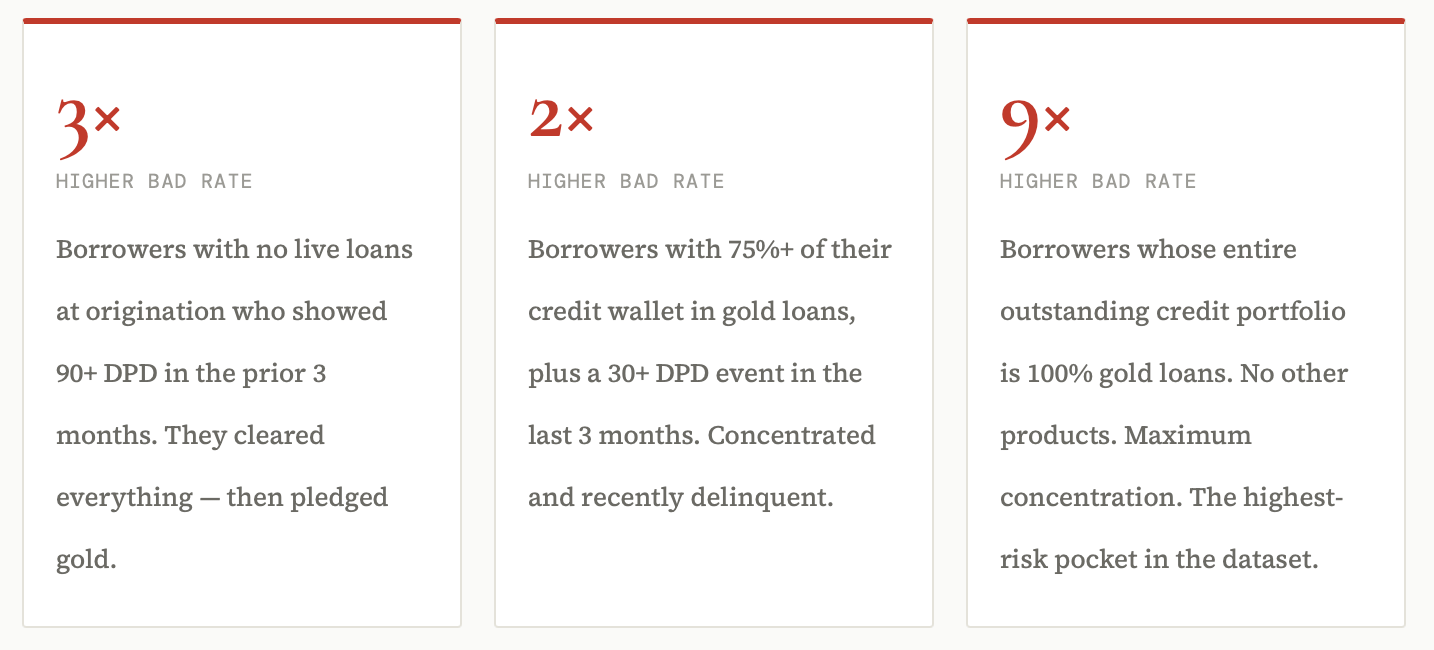
These are not theoretical risk factors — they are empirically validated against actual delinquency data from gold loan originations in January to December 2024, with performance tracked over the following 12 months. The signal is clean. The differentiation is large. And critically, the volume is not trivial: the 100% gold loan wallet cohort represents approximately 1% of originations — small in share, but large enough in absolute numbers to matter at portfolio scale.
A borrower whose entire credit existence is a gold loan is not a low-risk borrower with a preference for secured debt. They are a borrower who has been excluded from every other credit product — and is now pledging their last asset.
Signal One: Wallet Concentration
The first stress dimension is how much of a borrower’s total credit wallet is made up of gold loans at the time of taking a new one. The data tracks this as “Share of GL outstanding as % of total outstanding” — what we can think of as the gold loan wallet concentration ratio.
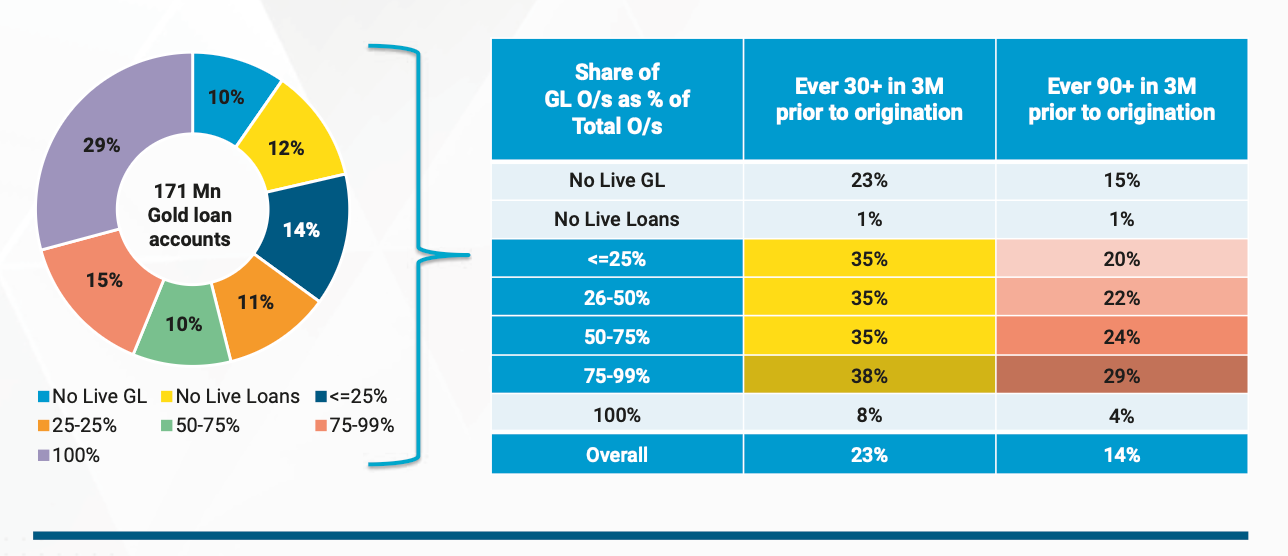
Going forward lets understand few terms.
Ever 30+ in 3M prior to origination means: any Gold loan which is originating, lets say in Apr’25 but the borrower has been reported as 30+ days past dues for any of the last 3 months which are Jan Feb Mar 2025. This can be any of his other loan. Any borrower becomes 30+ if he hasnt paid to the lender for 30 days after the due date. The lender submits this information to the credit bureaus.
Similarly 90+ in 3M is any borrower reported as 90+ for any of the retail loans in 3 months time prior to the new Gold loan origination.
The intuition here is straightforward. If a borrower has a home loan, a car loan, a credit card, and a small gold loan, the gold loan is one instrument among many. That borrower has demonstrated access to diverse credit products, has a repayment history across multiple instruments, and is borrowing against gold as a tactical, not desperate, choice.
If a borrower’s entire credit existence is gold loans — nothing else, no diversification, no other lender relationships — the picture is very different. That borrower has either been declined for other products, or has progressively closed down other obligations until gold is all that remains. Neither scenario reflects financial health.
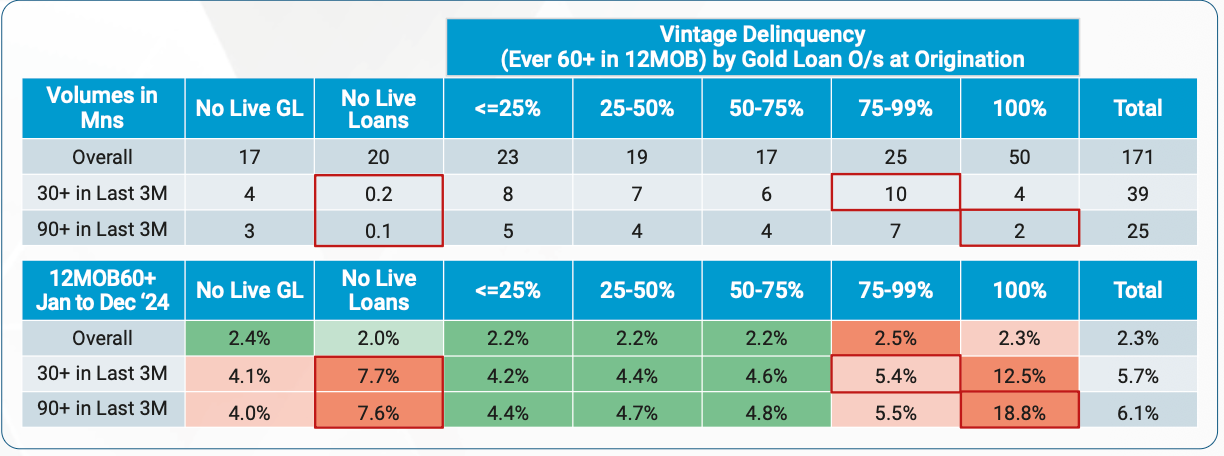
Read the chart carefully. The overall bad rate across all segments sits at 2.3% — that is the number a lender would see in their aggregate portfolio report. Comfortable. Within range. Not alarming.
Now look at the 100% GL wallet segment combined with 90+ DPD in the prior 3 months: 18.8%. That is not a rounding difference. That is a fundamentally different risk pool wearing the same “gold loan” label as the 2.0% borrower sitting next to it in the portfolio.
The Averaging Trap
When a portfolio grows fast, new originations dominate the book. The new loans are recent, not yet delinquent, and they dilute the bad rate. A 3.8x portfolio growth means the book in December 2025 is 73% composed of loans originated after March 2022. The denominator is growing faster than the numerator. This makes the aggregate bad rate look better than the underlying cohort performance.
This is exactly the dynamic that made MFI portfolios look pristine in 2024, one year before they collapsed. Watch the vintage-level bad rates, not the aggregate.
Signal Two: Recent Delinquency on Any Product
The second dimension is recent payment behaviour — specifically whether the borrower has shown 30+ DPD or 90+ DPD on any credit product in the 3 months before taking the gold loan.
This is a classic bureau-level signal in any credit model. Recent delinquency is one of the strongest predictors of future default because it tells you that the borrower is currently under financial stress — not historically stressed (which may have resolved) but actively struggling right now. They are behind on existing obligations and are taking a new loan.
In the gold loan context, this signal has an additional layer of meaning. A borrower who shows 90+ DPD across their credit book, then suddenly has no live loans at origination, has most likely used gold as a payoff mechanism — pledging gold to clear overdue obligations and reset their bureau profile. The gold loan is not consumer demand. It is a debt consolidation under distress.
The multiplier is consistent across ticket sizes and wallet types. Borrowers with 30+ DPD in the prior 3 months show approximately 2.5x the bad rate (5.7% for 30+ vs 2.3% for overall) of clean borrowers. Borrowers with 90+ DPD show ~ 2.7x (6.1% for 90+ vs 2.3% for overall). These ratios hold whether the ticket is ₹50K or ₹5 lakh.
This means that a lender relying purely on collateral value — “the gold is worth more than the loan, so I am protected” — is making a category error. The collateral protects the lender on recovery. It does not reduce the probability of default, which is what the bad rate measures. A default still requires the lender to auction the gold, manage operational risk, and absorb the reputational and regulatory cost of recovery.
MFI Parallel — Institutional Memory
In microfinance, the equivalent signal was multiple borrowing — a borrower with loans from 3 or more MFIs simultaneously. The bureau data showed this clearly before the crisis, but lenders continued originating because industry numbers were soaring and each individual loan looked secured by the borrower’s income (JLG guarantee). When stress hit, the guarantee was worthless because everyone defaulted together. In gold loans, the equivalent is multiple concurrent gold loans across lenders — and the data shows average accounts per borrower has moved from 2.3 to 2.9. That trajectory deserves attention.
Signal Three: The Last Resort Borrower
The most powerful — and most haunting — finding in this report is what happens to borrowers who take gold loans while already in severe distress, and what their credit trajectory looks like 18 months later.
CIBIL tracked gold loan originations from January to June 2024, identified those borrowers who had 90+ DPD in the 3 months before taking the gold loan, and then checked their active loan status in November 2025 — roughly 17 months later.
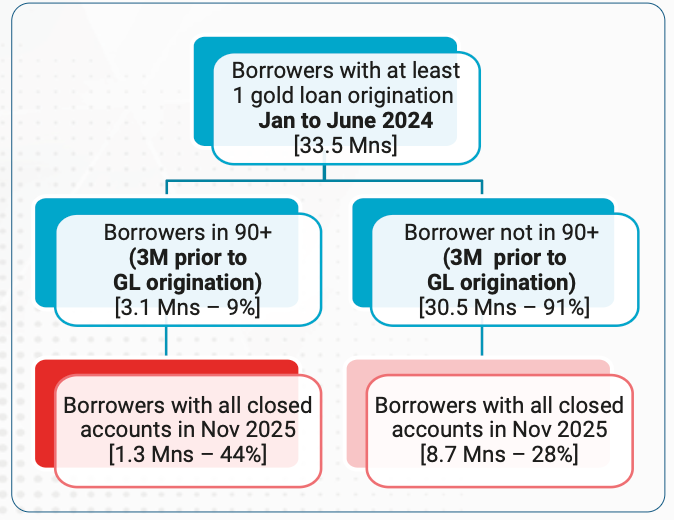
44% of stressed borrowers had all their accounts closed by November 2025 — compared to 28% of non-stressed borrowers. That is a 1.6x higher exit rate. They took a gold loan, used it, and then disappeared from the formal credit system entirely.
Among the stressed borrowers who did not close all their accounts — who remained in the credit system — more than one-third had only a gold loan still active in their wallet. No personal loan. No home loan. No credit card. Just a gold loan, standing alone as the last thread connecting them to formal finance.
This is what “product of last resort” means in bureau data. It is not a label or a characterisation. It is a measurable, observable pattern: distressed borrower → gold loan → credit system exit. The gold loan is the final transaction before financial exclusion.
The Financial Inclusion Implication
India’s credit architecture is built on the premise that formal credit access builds financial resilience. A borrower who pledges gold under distress and then exits the credit system has not been rehabilitated — they have been processed. The formal system extracted the collateral value and moved on. The borrower is now outside the system, with less gold and no credit history to show for it.
This is not an argument against gold loans. It is an argument for better rehabilitation pathways, borrower-level stress assessment, and underwriting that distinguishes between the tactical gold loan borrower and the distressed one.
Putting It Together: The Three-Segment Risk Framework
CIBIL’s analysis goes one step further and builds a three-segment risk classification of gold loan borrowers based purely on observable behaviours — no income data, no LTV, just bureau-level payment patterns and wallet composition. The segmentation is clean and the risk separation is large.
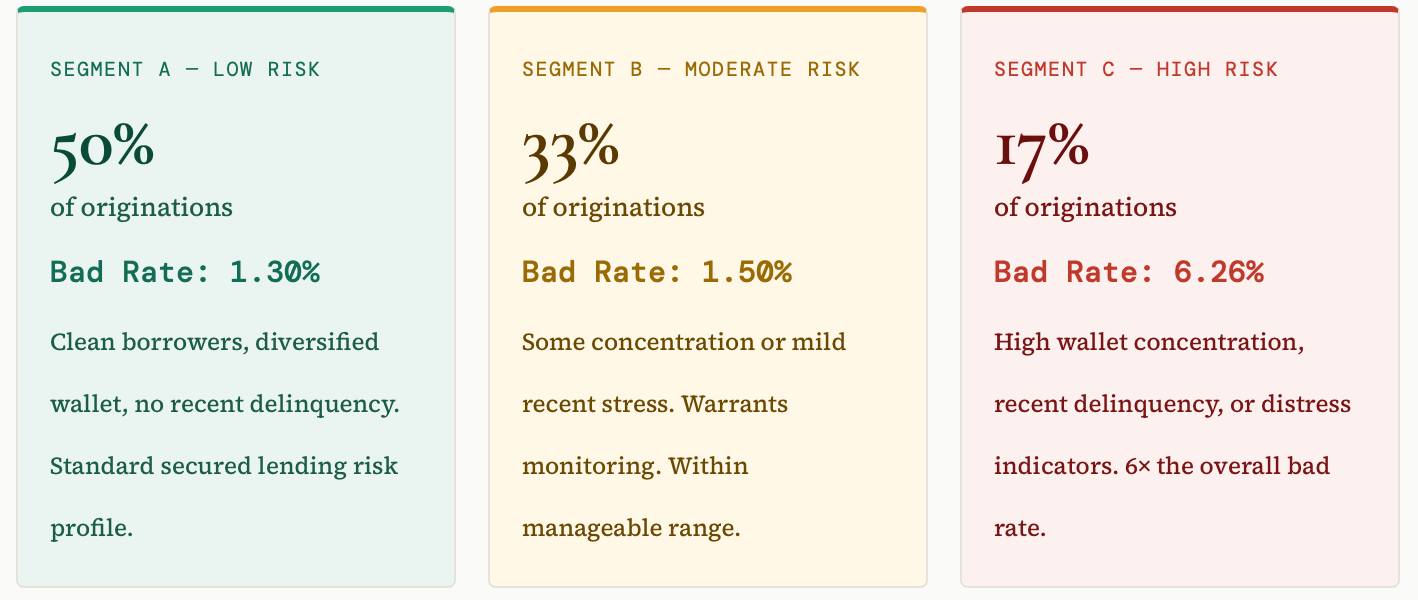
In the below chart notice Tthe 6x separation between Segment A and Segment C is striking. But notice what the overall bad rate of 2.2% conceals: Segment C, with its 6.26% bad rate, accounts for 17% of originations. In a rapidly growing portfolio, that 17% is a very large absolute number of loans going into distress.
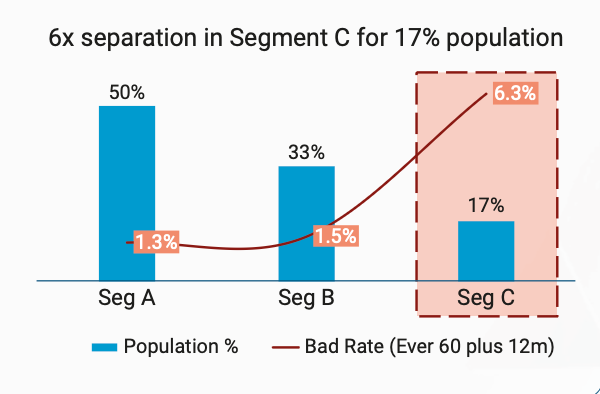
Do most gold loan lenders today know which of their originations fall into Segment C? The RBI framework requires LTV checks. It does not yet require behavioural segmentation of this kind at origination. That gap is where the portfolio risk lives.
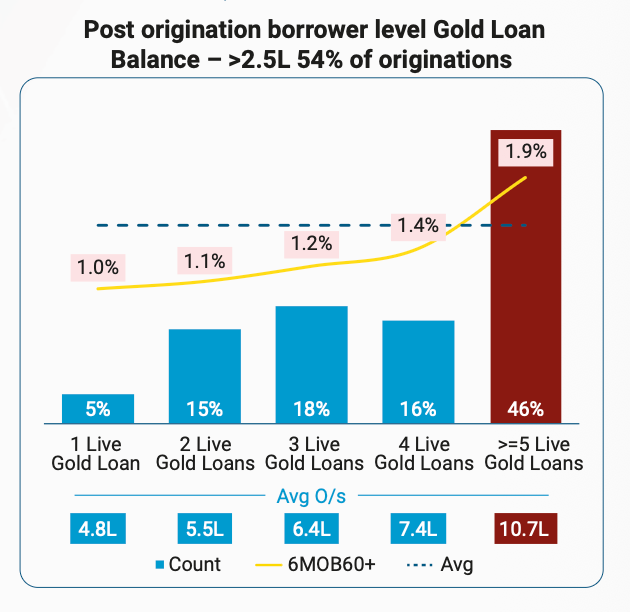
For borrowers with more than ₹2.5 lakh of gold loan outstanding post-origination, the delinquency rises steadily with the number of concurrent gold loans — from 1.0% for single-loan holders to 1.9% for those with 5 or more live gold loans. And 46% of this high-exposure cohort sits in the 5+ live gold loans bucket, carrying an average outstanding of ₹10.7 lakh across lenders.
Here is the uncomfortable arithmetic: a borrower with ₹10.7 lakh in gold loans across 5+ lenders has probably pledged most of their family gold. Each individual lender sees one loan. The bureau sees the full picture. Currently, the bureau-level cross-lender exposure check at origination is not consistently mandated for gold loans — which is precisely what the RBI’s 2025 directive is beginning to address.
Second-Order Thinking
First-order effect: Gold prices rise → collateral values rise → lenders feel more secure → more credit extended at higher LTV.
Second-order effect: Higher credit → more gold pledged → borrowers accumulate multiple concurrent loans → when gold prices correct or income falls → cascade default across a concentrated, highly leveraged borrower base with no diversification buffer.
The first order is visible in the portfolio growth data. The second order is visible in the behavioural signals CIBIL is now documenting. The gap between those two timelines is where portfolio managers need to be paying attention right now.
Utilisation of the above differential
The CIBIL data makes a clear case for three underwriting improvements that go beyond the current LTV-first model most gold lenders use:
First, wallet concentration scoring at origination. Before booking any gold loan, check what share of the borrower’s total credit wallet is already in gold loans. A borrower with 75%+ concentration is not a standard secured borrower — they are a concentration risk requiring different pricing or lower LTV.
Second, recent delinquency gating. Any borrower with 90+ DPD in the prior 3 months on any product should trigger a hard review — not an automatic rejection, but a mandatory deeper assessment. The 3x bad rate differential is large enough that no model should ignore it.
Third, cross-lender exposure validation. The average gold loan borrower now holds 2.9 accounts. Lenders need to know the total gold loan obligation across institutions before computing LTV, not just the single-facility LTV. The RBI’s 2025 directive moves in this direction, but implementation will be the test.
The Structural Constraint
Gold loan NBFCs compete primarily on speed. Top such lenders have built their franchises on “loan in 30 minutes, no income proof.” Adding bureau checks, wallet concentration analysis, and cross-lender exposure validation adds friction and time. If the check adds 2 days to disbursal, some borrowers will go to the competitor who does not do the check. The competitive dynamics make prudent underwriting genuinely difficult to enforce without regulatory mandate.
This is why the RBI directive matters — and why Part 3 of this series will examine exactly what the new framework changes, and how it changes the whole story.