India holds approximately 25,000 tonnes of household gold — more than any other country. For decades, this gold sat quietly in lockers and cloth pouches, surfacing only for weddings. That is changing, fast.
Gold loans have always existed in India. The moneylender version — informal, exploitative, often at usurious rates — is as old as the country’s agriculture cycle. What TransUnion CIBIL’s first-ever Gold Loan Landscape Report documents is something different: the formalisation, mainstreaming, and acceleration of gold-backed credit at a scale we have not seen before.
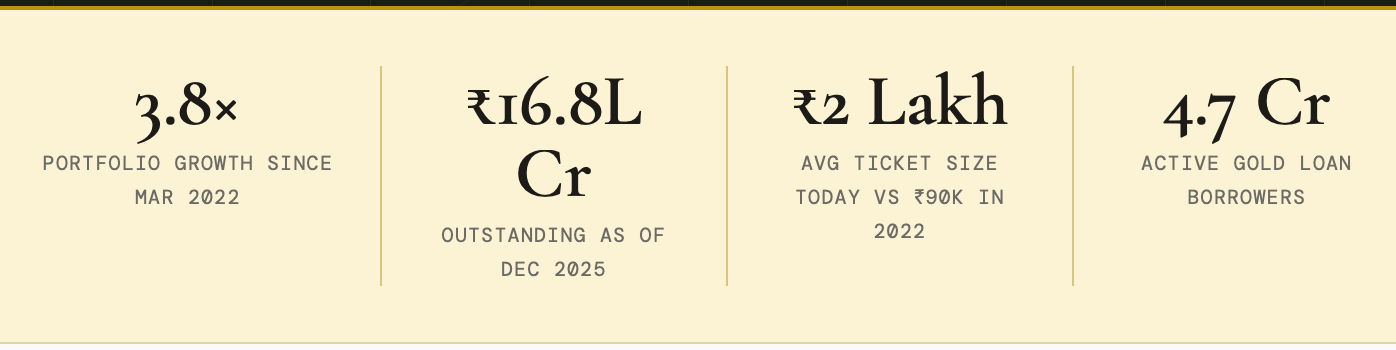
Between March 2022 and December 2025, the organised gold loan portfolio grew 3.8 times. In absolute terms, the outstanding gold loan book at ₹16.8 lakh crore now exceeds the personal loan portfolio at ₹15.4 lakh crore — despite having 2.1 crore fewer borrowers. That last sentence is worth sitting with. Gold loan borrowers are fewer in number but carrying more debt per person. The average outstanding per borrower moved from ₹1.9 lakh to ₹3.1 lakh in just three years.
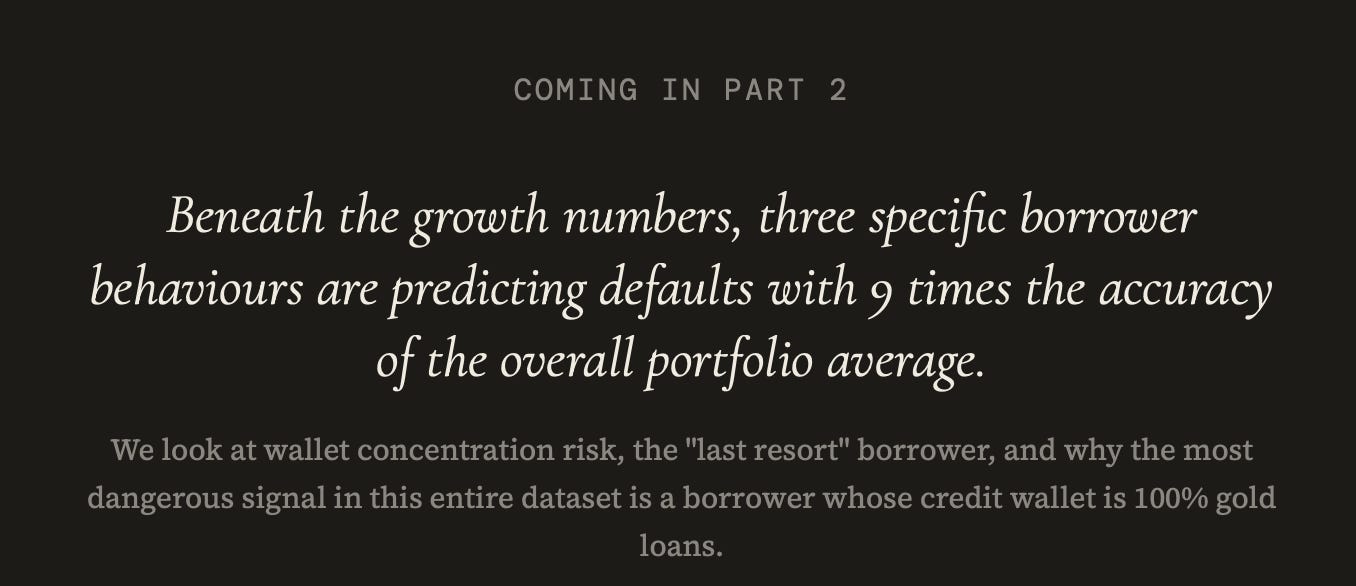
This is Part 1 of a three-part series. We start with the growth story — the numbers, who is driving it, where it is headed geographically, and how the borrower profile has shifted. In Part 2, we will look at the stress signals embedded in this data. In Part 3, we examine the RBI’s response and what it means for investors and borrowers alike.
The Portfolio Trajectory
To understand how fast gold loans have grown, look at the indexed growth chart below. The base (March 2022 = 100) reaches 379 by December 2025 — nearly quadrupled. More importantly, the acceleration is not slowing down. The slope steepens visibly from 2024 onwards.
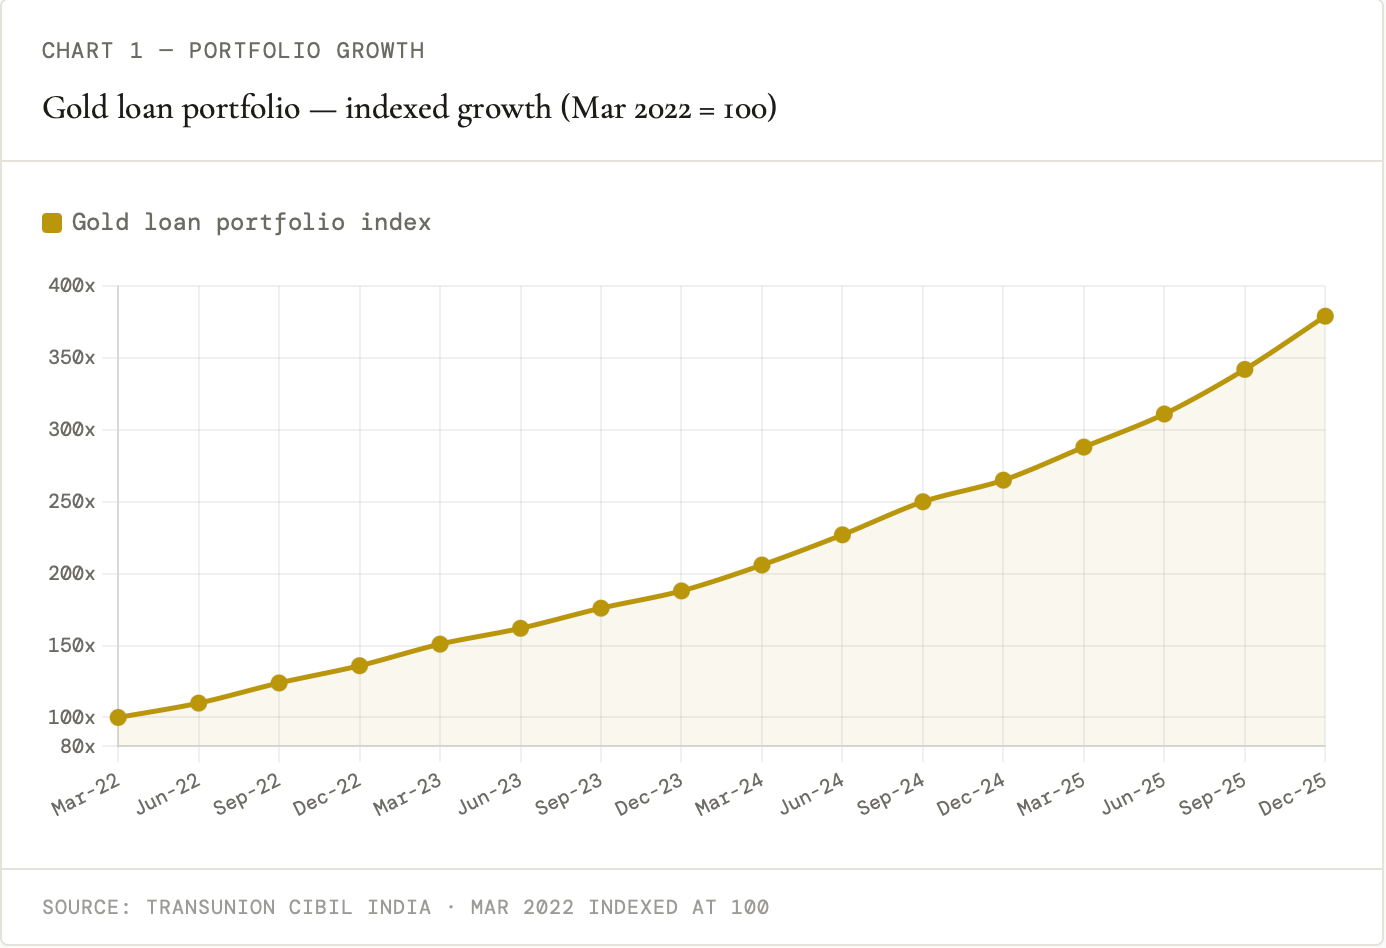
Source: TransUnion CIBIL India · Mar 2022 indexed at 100
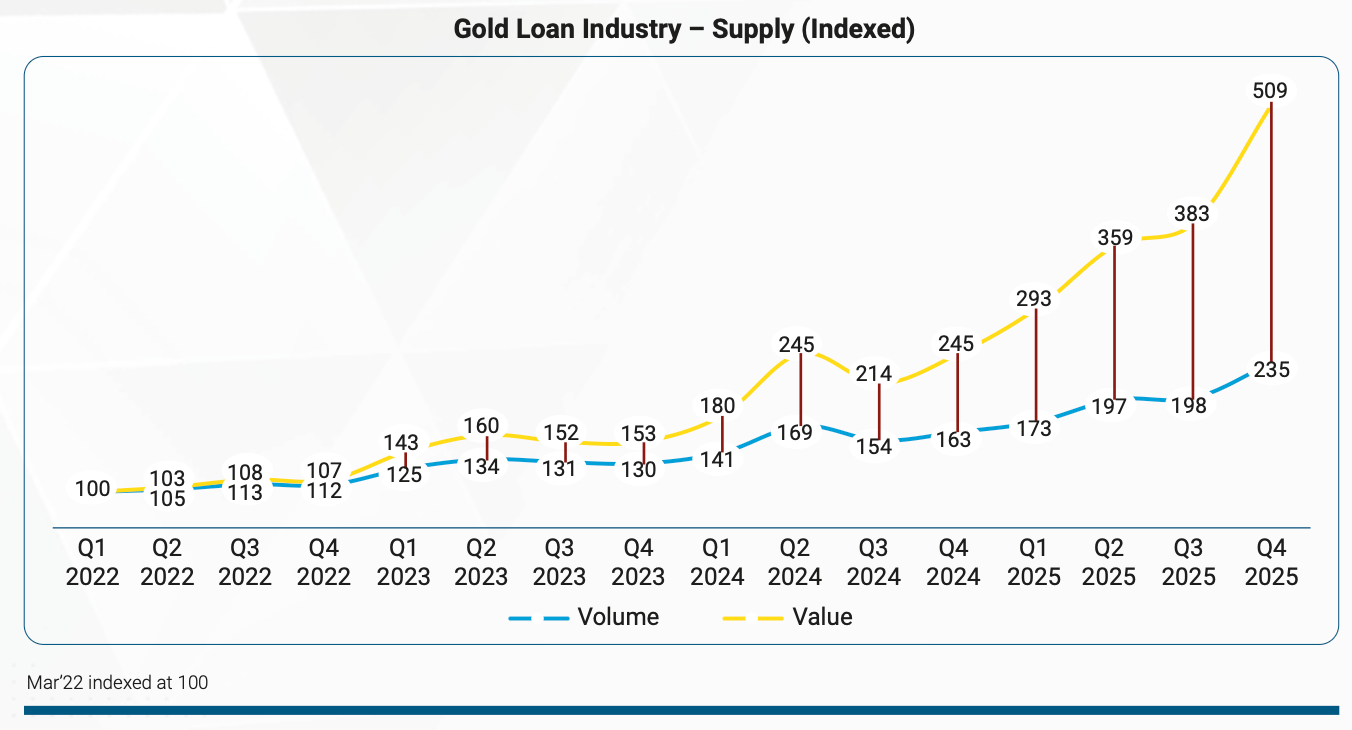
The most striking feature of the below chart is the divergence between volume and value. Origination volumes grew 2.3 times. But the value of originations grew 5.1 times. That gap — value outpacing volume by more than 2:1 — tells you the ticket size story before you even look at it explicitly.
Credit Risk Lens
When a portfolio grows faster in value than in volume, it means each borrower is taking on proportionally more debt. This is not inherently dangerous — if income and asset values rise proportionately, the leverage ratio holds.
The question is whether the underlying collateral (gold price) and borrower income are both rising at the pace implied by ticket size growth.
The answer is: gold prices have, but borrower incomes are less certain.
Who Is Actually Lending?
Not all lenders are winning equally. The CIBIL data shows a clear winner in this cycle: NBFCs. They have grown their gold loan outstanding 8.9 times since March 2022. PSU banks grew 3.8 times. Private sector banks grew just 2.4 times.
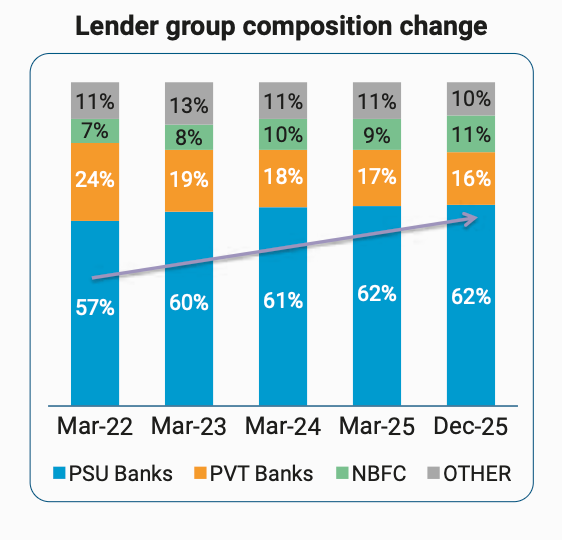
Note: Composition reflects % share of total outstanding balances
The interesting dynamic here is that PSU banks hold 62% of the outstanding balance but NBFCs are the growth engine.
There is a structural reason for this: NBFCs like Muthoot and Manappuram built their entire business model around gold loans — fast disbursals, high LTV, branch-level operations, no questions about income proof. They are the marginal player in the growth story, willing to lend faster and at higher leverage than PSU banks.
Meanwhile, PSU banks have the highest average ticket size — 31% of originations but 40% of value in 2025. They lend less often but lend bigger. This tells you something about who their gold loan customers are: likely existing relationship customers with larger loan requirements, not the stressed borrower walking in off the street.
The Ticket Size Has Doubled
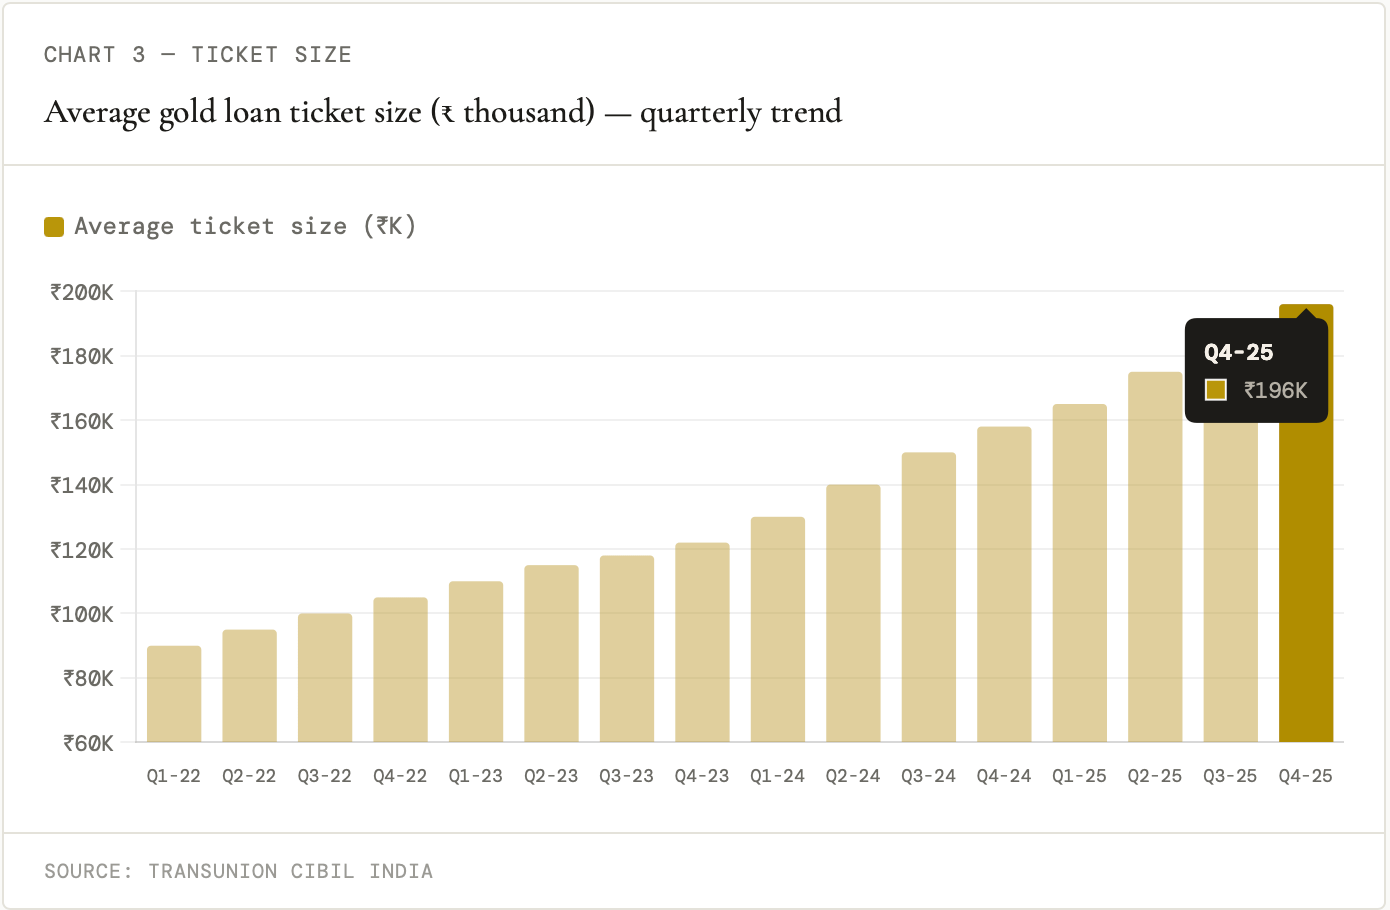
The average ticket size moved from ₹90,000 in Q1 2022 to ₹1,96,000 in Q4 2025 — more than doubled in three years. NBFC ticket sizes grew 2.8 times, PSU banks 2 times, private banks 2.6 times. Every lender category shows the same directional shift.
Average gold loan ticket size (₹ thousand) — quarterly trend
Part of this is mechanical — gold prices have risen sharply over this period. A borrower pledging the same jewellery in 2025 gets a significantly larger loan than in 2022 because the collateral value has appreciated. But that is only a partial explanation. The growing share of ₹2.5L+ ticket loans (from 13% to 20% of originations) and ₹5L+ loans (from 2% to 6%) suggests borrowers are also pledging more gold and borrowing more deliberately — not just receiving higher LTV on the same collateral.
When collateral appreciates faster than borrower income, the apparent quality of a secured loan can mask the actual repayment risk. The gold is worth more. The borrower is not necessarily richer.
The Borrower Has Changed
This is where the data gets genuinely interesting. Who is taking gold loans in 2025 is fundamentally different from who was taking them in 2022.
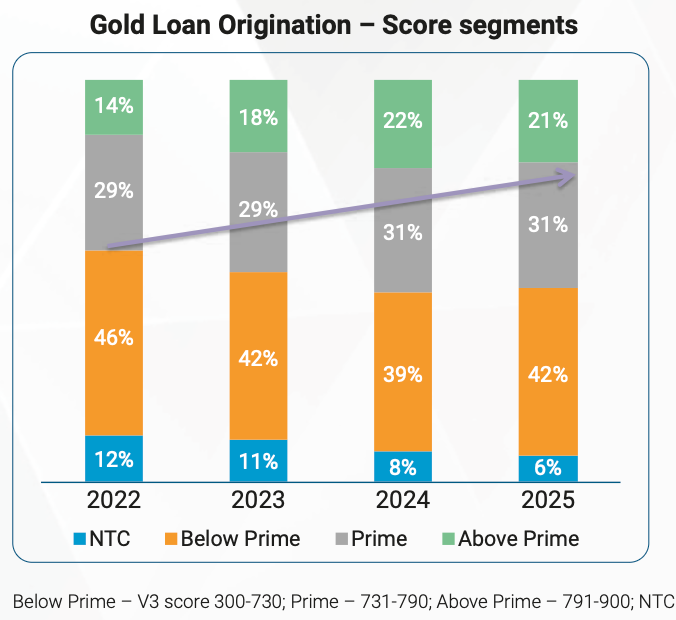
In 2022, gold loans were largely associated with borrowers who could not access other forms of formal credit — New to Credit (NTC) customers with thin files, or Below Prime borrowers with impaired histories. They used gold as a workaround to formal credit denial. The product had a stigma. It was the loan you took when you had no other option.
NTC- New To Credit
The shift is clear. Borrowers with Score >730 (Prime and Above Prime borrowers) together accounted for 43% of originations in 2022. By 2025 that share had risen to 52%. New To Credit borrowers’ participation dropped from 12% to 6%. These are not distressed borrowers anymore — or at least, not only distressed borrowers.
Gold loans are increasingly being taken by creditworthy individuals who choose to borrow against their gold — not because they cannot access unsecured credit, but because gold loans offer better rates, faster processing, and no scrutiny of end-use. It is the same logic behind margin loans on equity portfolios: why take an expensive personal loan when you can pledge an appreciating asset?
What This Shift Means
The improving credit quality at origination is real. But it does not mean the portfolio is getting safer in aggregate. Prime borrowers with multiple concurrent gold loans across lenders — which the CIBIL data shows is increasing — present a different and less visible risk than a single NTC borrower. The risk has changed shape, not necessarily reduced.
The Geographic Expansion
Gold loans have historically been a South India story. Tamil Nadu, Kerala, Andhra Pradesh, Karnataka — states where household gold-holding is highest and gold loan culture most established. Tamil Nadu alone accounts for 25.8% of all originations. The South still dominates volume.
But the growth story has moved North. Look at the year-on-year growth rates from 2024 to 2025:
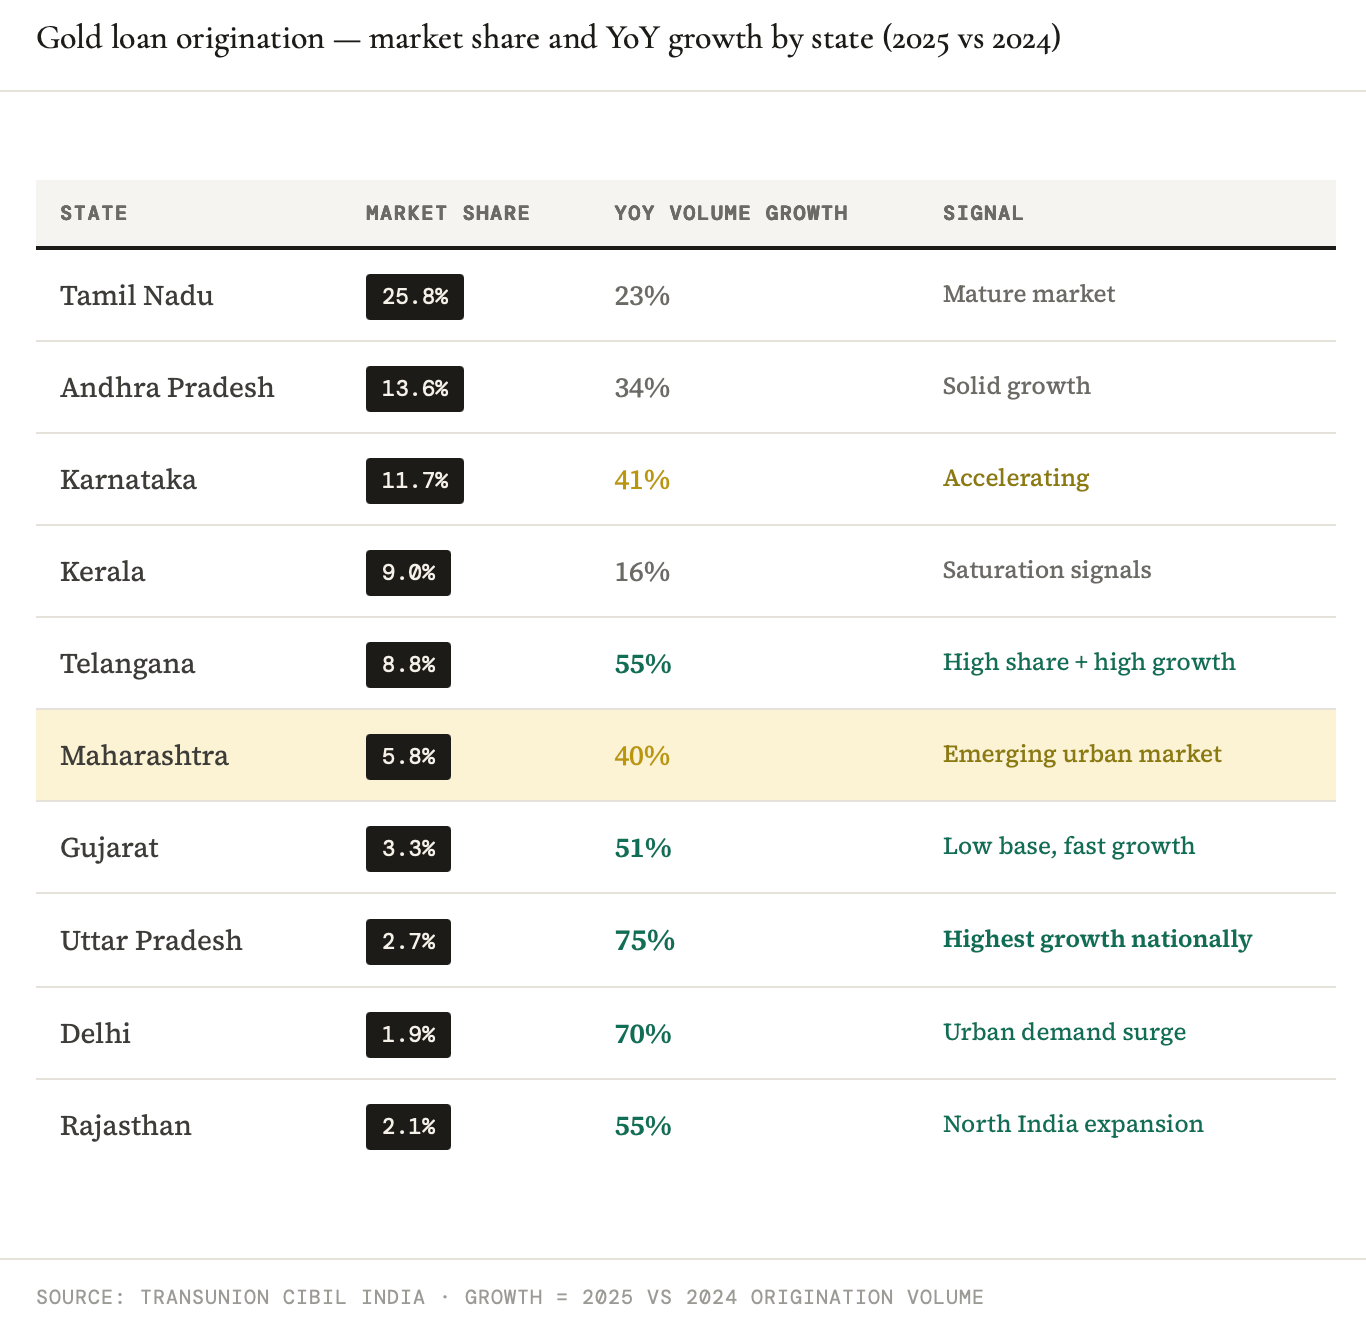
Uttar Pradesh at 75% growth. Delhi at 70%. Rajasthan at 55%. These are states where gold loan culture was historically thin — not absent, but far less formalised than the South. The organised lender expansion into these markets is structural, driven by NBFC branch rollouts and increasingly by digital gold loan platforms.
The unit economics in new markets tend to be better initially (lower competition, eager borrowers) but the credit quality in thin-file markets takes time to establish.
Women Borrowers: The Quiet Surge
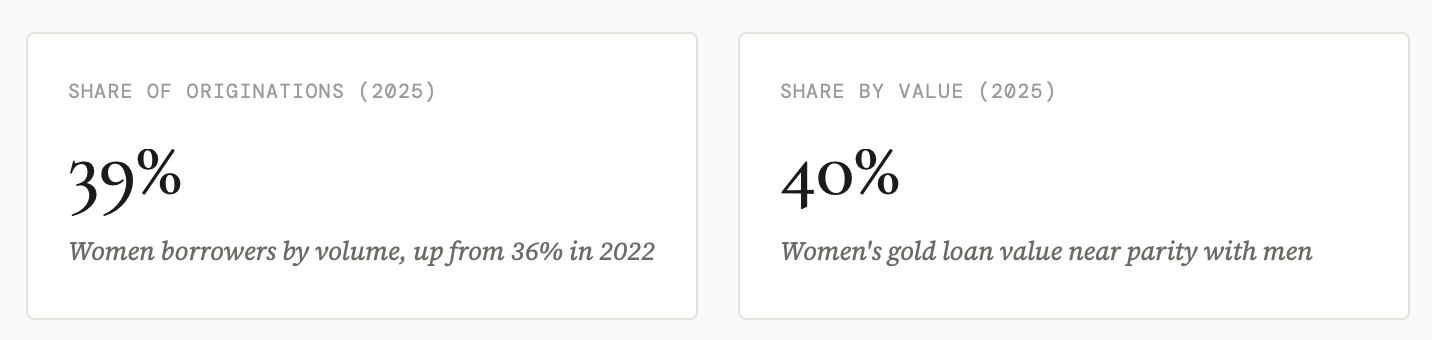
Women borrowers now account for 39% of originations by volume and 40% by value.
The gap between volume share and value share is notable — women are taking slightly larger ticket loans on average relative to their share. The growth in women’s gold loan originations from West and North India is especially pronounced:
UP at 325% growth among women borrowers since 2022,
Haryana at 311%,
Gujarat at 282%.
What it does tell us is that the organised gold loan market has stopped being a men-only story — and that the regulatory and underwriting frameworks need to account for this.
What we are not yet seeing in this data
The geographic expansion into North India and the growth in women borrowers are positive inclusion signals. But new markets and new borrower segments take time to reveal their credit quality. Delinquency data lags disbursement data by 12–18 months. The stress in these newer cohorts will become visible in 2026 data — not yet in what we can read today.
The Bigger Picture: What This Growth Means
To summarise what Part 1 has established: India’s gold loan market is undergoing a genuine structural transformation. The product has moved from being a last-resort instrument for the credit-excluded to a mainstream secured borrowing tool used by creditworthy households as part of a deliberate leverage strategy.
This transformation is being driven by three converging forces.
First, rising gold prices have inflated collateral values, making the same gold worth more as a borrowing base.
Second, NBFC expansion into new geographies has brought supply-side competition that has improved customer experience and reduced friction.
Third, borrower sophistication has increased — people increasingly understand that pledging gold at 12–14% is cheaper than taking a personal loan at 18–22%.
None of this is inherently dangerous. Secured lending against appreciating collateral with improving borrower quality sounds like a textbook underwriting positive. And taken at face value, the portfolio metrics support that reading.
But there is more to this story.
All data sourced from TransUnion CIBIL Gold Loan Landscape Report, April 2026. This newsletter is for informational and educational purposes only. Nothing here constitutes investment advice.