When I started investing in the defence companies almost 4 years back (Russia -Ukraine War) I always thought of aircraft manufacturer as the prime money maker in the defence sector.
Now, let me start with a question that sounds simple but contains the entire investment framework for this sector.
Which company earns more — the one that manufactures India’s fighter aircraft, or the one that builds the radar system inside it?
The instinctive answer is the aircraft manufacturer. It is more visible, more strategically critical, and more capital-intensive. It requires decades of engineering capability, government certification, and a sovereign-level mandate.
The correct answer, measured by operating margin, is the radar manufacturer.
Data Patterns, which supplies radar subsystems, avionics, and electronic warfare systems to India’s defence platforms,
earns an EBITDA margin of 38–39%.
HAL, which manufactures India’s fighter aircraft,
earns an EBITDA margin of 22–23%.
That is a 15–16 percentage point gap between a subsystem supplier and the prime integrator it supplies. Understanding why this gap exists — and why it will persist and potentially widen — is the foundation of a sound investment framework for Indian defence stocks.
But the margin story is only half the picture.
The other half is indigenisation — the policy-backed, mandate-driven dismantling of India’s import dependence and the reconstruction of its defence supply chain around domestic IP. These two stories — the margin premium at the electronics layer, and the indigenisation transfer of revenue from foreign to domestic companies — are not separate. They are the same story told from two different angles.
Part 1: The Value Chain Map
India’s defence industrial ecosystem is organised across five distinct tiers. Each has different economics, different risk characteristics, and different investment implications.
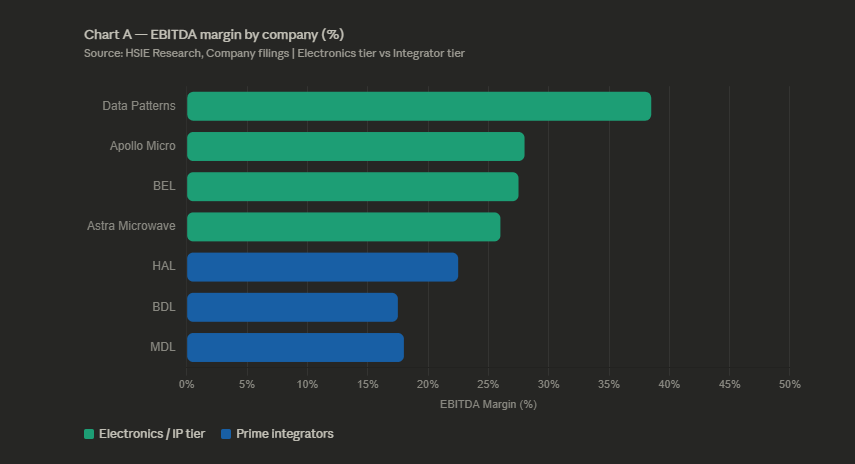
EBITDA margin comparison. Green bars = electronics tier, blue bars = prime integrators. The visual gap between Data Patterns at 38.5% and MDL at 18%.
Tier 1 — Prime Integrators
These are the companies holding the prime contract with the Ministry of Defence — bearing final delivery responsibility and owning the customer relationship with the armed forces.
HAL manufactures fighter aircraft and helicopters. MDL builds destroyers, frigates, and submarines. BDL manufactures guided missiles and torpedoes. BEL operates as both a prime electronics integrator and a subsystem supplier — a hybrid that earns margins closer to the private electronics tier than to HAL or MDL.
Their margin profiles: HAL at 22–23% EBITDA, MDL at 17–19%, BDL at 14–21% depending on execution year. Solid margins for capital-intensive manufacturing. Not the highest in the ecosystem.
Tier 2 — Electronics, Radar, and Avionics Subsystems
This is where the margin premium lives.
Data Patterns operates at 38–39% EBITDA. Astra Microwave at 25–27%. Apollo Micro at approximately 28%. BEL at 27–28% — higher than its DPSU peers precisely because of its electronics-intensive model.
These are private sector and DPSU companies supplying mission-critical electronics to Tier 1 integrators and directly to DRDO for development programmes. Their margin advantage is structural, not cyclical.
Tier 3 — MSME Component Suppliers
India now has 16,000+ MSMEs actively participating in the defence supply chain — suppliers of forgings, castings, precision-machined parts, and electronic assemblies. Margins here are thin — typically 6–12% EBITDA — and almost entirely unlisted. Their significance to the investment thesis is indirect: a healthy MSME base reduces import dependence for Tier 1 and Tier 2 companies, improving their economics over time.
Tier 4 — MRO and Lifecycle Services
Every platform manufactured accumulates a 30–40 year MRO tail (Maintenance, Repair, and Overhaul ). HAL’s MRO business contributes approximately 50% of its total revenues — at margins higher than its manufacturing segment, because MRO revenue is recurring, relationship-locked, and difficult to displace once established.
BEL’s annual maintenance contracts on deployed systems — Akash, LRSAM, the electronic fuses programme — represent a growing recurring revenue stream that compounds with every new platform inducted into service.
The MRO layer is consistently undervalued in retail analysis. It is the layer that makes defence companies resilient businesses rather than lumpy project contractors.
Tier 5 — R&D and Design Authority
DRDO and ADA (Aeronautical Development Agency) sit here. They earn no commercial revenues but determine programme architectures and vendor selections that define who wins contracts at every tier above them.
The investment implication: companies that embed themselves in DRDO development programmes early — accepting thin margins on developmental contracts — earn structural incumbency in the production phase that follows. Data Patterns deliberately maintains 40% developmental orders in its orderbook. The development phase is the moat-building phase. The production phase is where the margin is harvested.
Part 2: Why the Electronics Tier Earns a Structural Premium
The margin gap between electronics subsystem suppliers and prime integrators has three causes — and all three are structural rather than cyclical.
Cause 1 — IP Ownership
An electronics company that designs its own radar subsystem, electronic warfare suite, or avionics module owns the intellectual property. The prime integrator assembling the platform does not own the IP on the components inside it. IP commands a permanent premium over assembly — across every industry, and in defence more than most because the IP is certified, qualified, and impossible to replace mid-programme.
Cause 2 — Switching Costs
Once an electronics subsystem is certified and qualified for a specific defence platform, it cannot be replaced without triggering an entirely new certification cycle — a process that can take years and costs significant money. The qualified supplier has structural pricing power for the entire production run and the subsequent MRO lifecycle. In Indian defence, that means 20–30 years of captive revenue from a single design win.
Data Patterns’ library of 1,000+ reusable COTS building blocks means the company’s switching cost advantage compounds across programmes. A customer cannot replace Data Patterns’ radar signal processor with a competitor’s equivalent without re-qualifying the entire radar system. That qualification was done once, at the customer’s expense, and it locks in the relationship.
Cause 3 — Indigenisation Mandate
This is the most powerful and most underappreciated cause. Foreign competitors are legally prohibited from competing for indigenised items under India’s procurement framework. For an expanding list of electronics categories — covering everything from transmit/receive modules for AESA radars to electronic warfare subsystems to avionics displays — domestic companies face zero international price competition.
This is not a tariff or a preference. It is a ban. And the list of banned imports is growing.
Part 3: The Indigenisation Transfer — Why Every Rupee Leaving a Foreign Supplier Enters a Domestic One
Here is the number that anchors the entire indigenisation story.
In 2015–19, India was the world’s largest arms importer — 9.8% of all global arms imports. Russia supplied 55% of that. France, Israel, and the USA supplied most of the rest. India reported a decline in imports during 2020–2024 as compared to 2015-2019. Russia India’s dominant supplier saw its share fall to 36% in 2020–24 from 55% in 2015–19, driven by sanctions, supply chain stress, and capacity diversion to the Ukraine conflict.
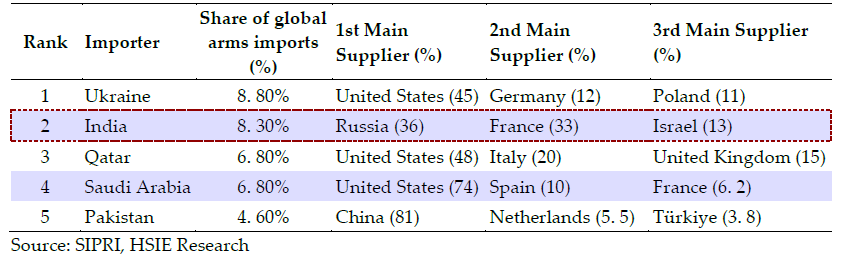
That import flow represented an enormous annual transfer of procurement spending to foreign manufacturers. Every rupee in that flow was a rupee not entering a domestic company’s revenue line.
That flow is now being redirected — permanently and at scale.
The Policy Mechanisms Driving the Redirect
The import ban is the bluntest instrument. Starting August 2020, the Ministry of Defence began banning imports of specific weapon systems and subsystems in phases. The first list barred 101 items. A second added 108 more. A further embargo on 351 subsystems followed. Cumulative result: 560 weapon systems and subsystems where procurement must now flow to domestic companies — regardless of whether a cheaper or more capable foreign alternative exists.
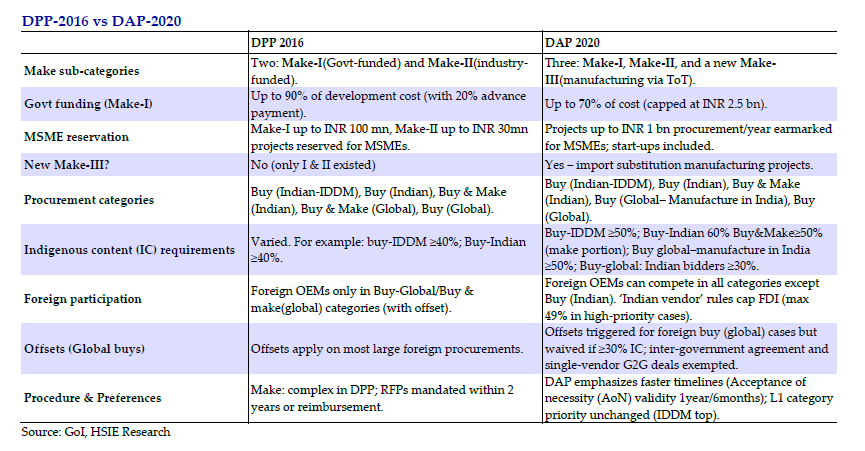
The DAP-2020 procurement hierarchy is more nuanced. It organises capital procurement into five categories ranked by priority. At the top: Buy IDDM — indigenously designed, developed, and manufactured, Indian vendors only, minimum 50% indigenous content. At the bottom: Buy Global — open to foreign suppliers. When an Indian company qualifies for the IDDM category, it competes only against other Indian companies. Foreign OEMs are excluded entirely from the highest-priority procurement category.
The Positive Indigenisation Lists operate at the component level. By mid-2024, 4,666 items had been listed for mandatory domestic sourcing — of which 2,972 have been completed. DPSUs placed INR 75.7 billion of orders on Indian vendors as a direct consequence in three years.
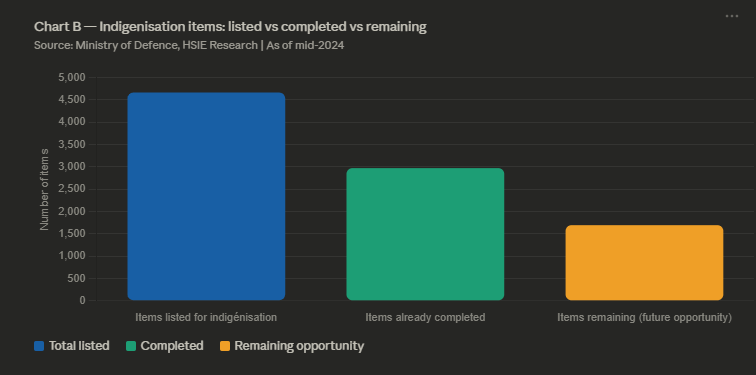
Indigenisation tracker. Three bars: total listed (4,666), completed (2,972), remaining (1,694 in amber). That amber bar is the visual representation of future domestic revenue opportunity
What Indigenisation Does to Margins
The financial impact is direct and measurable, and BEL’s P&L is the clearest illustration.
BEL’s EBITDA margin expanded from 21.2% in FY20 to 28.8% in FY25. This was not driven by pricing power or volume leverage alone. It was driven by a rising proportion of indigenously developed products — from roughly 60% of revenue in FY20 to 74% in FY25. Each imported component replaced by an in-house equivalent removed a royalty payment, eliminated a forex exposure, and allowed BEL to capture the full IP-to-production margin rather than just the assembly fee.
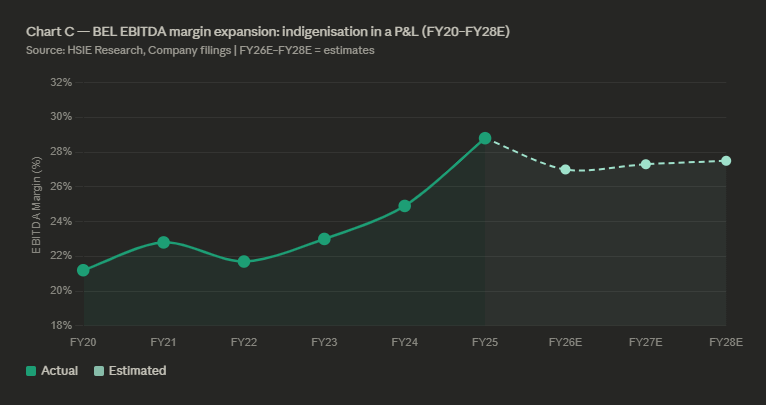
BEL margin expansion. Solid green line for actuals (FY20–FY25), dashed lighter line for estimates (FY26E–FY28E). The 21.2% to 28.8% climb tells the indigenisation story
MDL’s indigenisation story operates at the platform level. The indigenous content in its ships grew from 42% in the P-15 Delhi class destroyers built in the 1990s to 75% in the P-17A Nilgiri class frigates currently under construction. Each percentage point of that increase represents cost removed from the bill of materials and margin added to the company’s economics.
Part 4: The Export Dimension
The indigenisation story has a second chapter that is still being written.
India’s defence exports grew 34x in a decade — from INR 7 billion in FY14 to INR 234 billion in FY25. The government targets INR 500 billion by FY29.
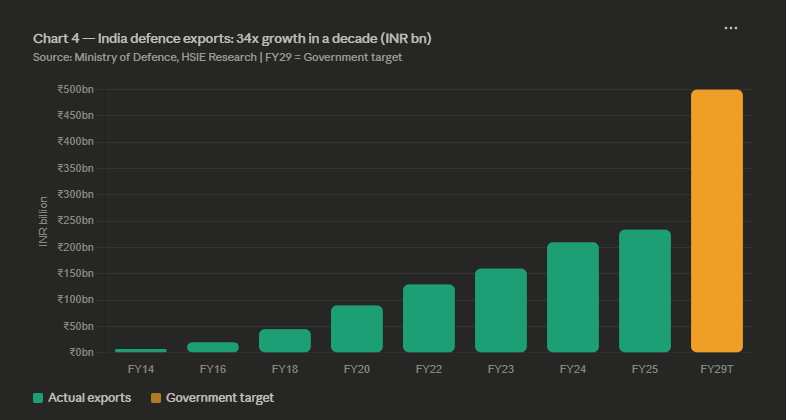
This export growth is not independent of indigenisation. It is a direct consequence of it.
A country cannot credibly export defence systems that depend heavily on foreign components — both because foreign OEMs typically restrict re-export rights on technology transferred to India, and because the cost economics of assembled foreign components make Indian exports uncompetitive on price.
The companies building genuine Indian IP — in radars, missiles, electronic warfare, avionics — are the same companies that will drive export growth. The domestic indigenisation effort and the export ambition are two expressions of the same underlying industrial capability-building. Investors who understand the indigenisation story are therefore also positioned ahead of the export story, because the same companies benefit from both.
Part 5: What This Means for Portfolio Construction
The value chain analysis and the indigenisation story together point toward a clear investment principle: weight toward the electronics and IP-ownership tier, not toward the prime integrator tier.
This does not mean avoiding HAL or MDL entirely. HAL’s MRO monopoly is a genuine long-term asset — 50% of revenues, recurring, compounding with every new platform inducted. MDL’s INR 3 trillion submarine pipeline is transformative for the company’s medium-term revenue profile. Both carry legitimate thesis points.
But on pure margin and return-on-capital metrics, the electronics tier is structurally superior. And the indigenisation transfer is flowing disproportionately toward companies that own Indian IP — not toward companies that assemble foreign designs under licence.
BEL is the anchor. It is the largest DPSU electronics company in India, with a 60% domestic market share in defence electronics, a 3.0x book-to-bill, and the largest listed defence electronics orderbook in the country. Its margins are closer to the private electronics players than to HAL or MDL — and they are still expanding as indigenisation deepens.
Data Patterns and Astra Microwave are the growth compounders — smaller in absolute revenue, faster growing, with the IP moats and DRDO relationships that position them for the next decade of platform programmes.
The indigenisation story is not background context for these companies. It is the mechanism by which their addressable market expands — automatically, mandatorily, at the government’s direction — without requiring them to win new customers or enter new geographies.
Every percentage point of import substitution still ahead of India is a percentage point of future revenue flowing into their order books.
And India is still, by most measures, in the early phase of that transfer.
Next post: How to read a defence company’s financials — book-to-bill, MRO lifecycle revenue, indigenisation margin impact, and the metrics most retail analysis ignores.