I read the report applying two distinct mental models. Reading the report as a Retail Investor and then as a Fund Manager.
The company is HAL — Hindustan Aeronautics Limited. India’s only fighter aircraft manufacturer, a Maharatna DPSU, and the most discussed defence stock in Indian equity markets.
I, The retail investor, open the annual report.
The first number I’d find is the order book: INR 2.4 trillion. I’d note that this is the largest defence order book among listed Indian companies. I’d observe that revenues in FY25 were INR 310 billion — meaning the order book represents nearly 8 years of current revenue. I’d conclude that HAL has exceptional revenue visibility and is therefore a strong long-term buy.
I, The fund manager, open the same report.
I’d find the same INR 2.4 trillion number. Then I’d ask a different question: at what rate is this order book converting to revenue? I’d calculate that HAL’s manufacturing segment — which should be the primary beneficiary of new platform orders — grew at only 7.8% CAGR during FY19–25, even as the order book expanded from 2.9x to 6.1x book-to-bill over the same period. I’d conclude that the order book is real but execution is the constraint — and that the current valuation may already price in a recovery that hasn’t yet materialised.
Same data. Completely different conclusions.
The difference is not access to information. Both the retail investor and the fund manager are reading the same publicly available annual report. The difference is the framework — which metrics they look for, what questions those metrics trigger, and how they interpret the answers.
This post is that framework. Five metrics that institutional investors use to evaluate defence companies — and what each one actually tells you.
Metric 1 — Book-to-Bill Ratio: The Most Cited and Most Misread Number
What it is: Order backlog divided by annual revenue. A book-to-bill of 3.0x means the company has 3 years of current revenue contracted and waiting to be executed.
How retail reads it: Higher is better. A 7x book-to-bill means 7 years of visibility. Buy.
How fund managers read it: Context-dependent. The book-to-bill tells you about demand. It tells you nothing about execution. A rising book-to-bill can mean two completely opposite things — strong new order inflows, or weak revenue conversion. You need additional data to know which.
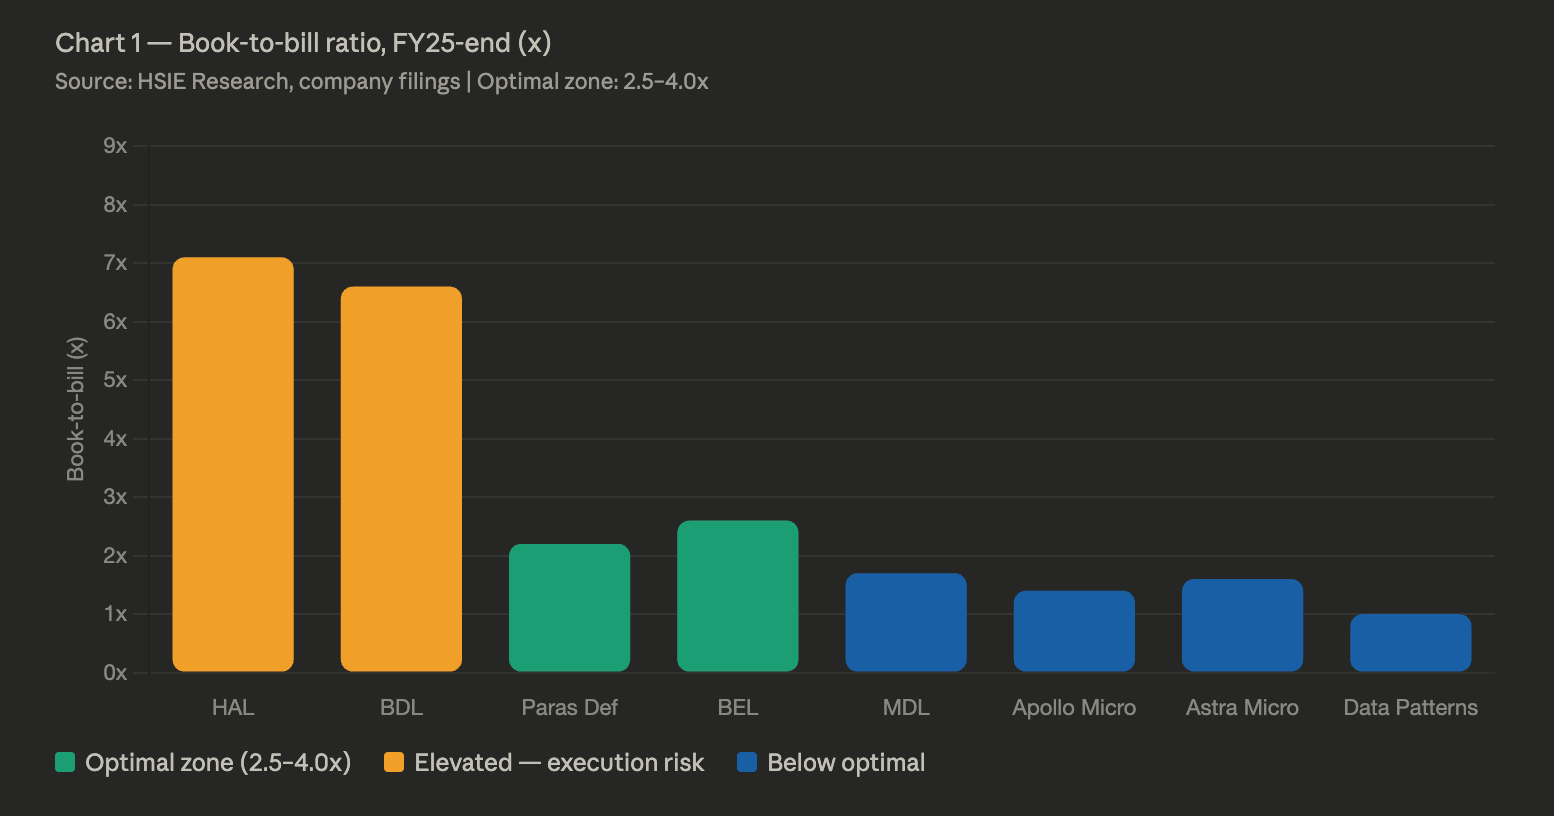
Book-to-bill ratio (FY25-end) — HAL and BDL’s elevated ratios reflect execution backlogs as much as demand strength. BEL’s 3.0x is in the efficient execution zone. Source: HSIE Research, company filings.”
The optimal book-to-bill for a well-functioning defence company is roughly 2.5–4.0x — enough forward visibility to provide revenue predictability, not so high as to signal chronic execution failure.
HAL at 7.1x and BDL at 6.6x are not signals of extraordinary demand. They are signals that order inflows have been consistently outpacing deliveries — a distinction that changes the investment interpretation entirely.
BEL at 3.0x sits in the optimal zone. MDL at 2.8x will change dramatically once the P-75 and P-75(I) submarine contracts are awarded — making it the most interesting book-to-bill inflection point to watch in the near term.
The question to ask after every book-to-bill number: Is it rising because of strong new order wins, or because execution is lagging? If the book-to-bill has been rising steadily for 4–5 years while revenue CAGR has been in single digits — the answer is execution lag.
Metric 2 — Execution Rate: The Metric Nobody Talks About
What it is: Revenue recognised in a year divided by the opening order backlog. This tells you how efficiently a company is converting its contracted order book into actual revenue.
Why it matters: Two companies can have identical book-to-bill ratios and completely different earnings trajectories — simply because one converts its backlog efficiently and the other does not.
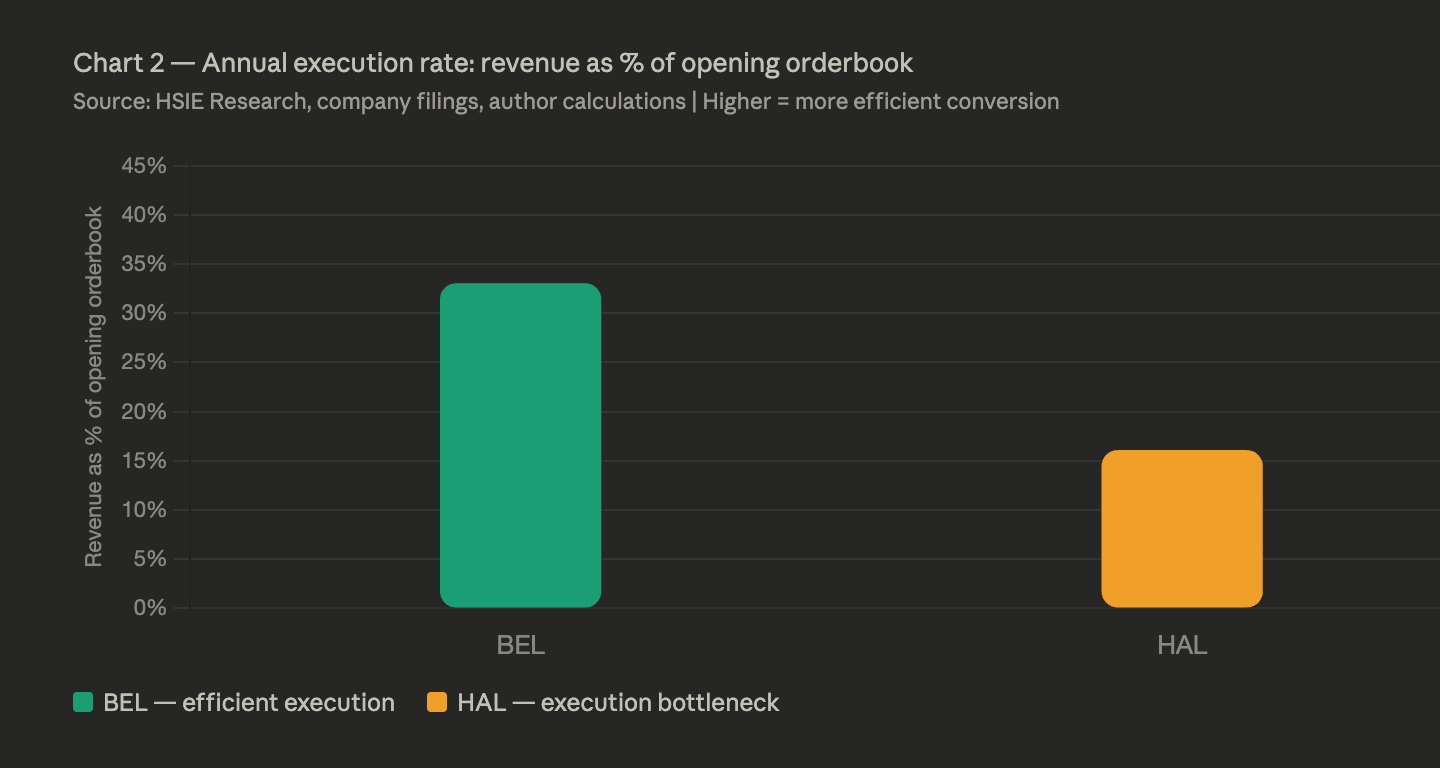
Execution rate: “BEL converts approximately twice as much of its opening orderbook to revenue annually as HAL. Source: HSIE Research, company filings, author calculations.
HAL converts approximately 16% of its opening order backlog to revenue in a given year — implying a 6+ year conversion cycle on average. BEL converts approximately 33% — a 3-year cycle. Both have large order books. Only one is deploying its backlog efficiently.
The earnings upgrade signal: When a company’s execution rate accelerates — typically driven by resolution of a supply chain bottleneck, ramp-up of a new production line, or milestone achievement on a large programme — the revenue growth rate moves sharply higher. This is the moment institutional investors are positioning for in HAL — waiting for the GE F-404 engine supply to normalise and the Tejas production rate to step up from 2–3 aircraft per year to the targeted 16–24 per year.
The execution rate is calculated from publicly available data and takes about 5 minutes to compute. Most retail analysis never mentions it. It is arguably the single most important leading indicator of near-term earnings surprise.
Metric 3 — MRO as Percentage of Revenue: The Hidden Resilience Signal
What it is: The proportion of total revenue coming from maintenance, repair, and overhaul of existing platforms — as opposed to new platform manufacturing.
Why most retail analysis ignores it: New platform orders are exciting and get coverage. MRO is unglamorous. It doesn’t generate press releases.
Why fund managers watch it closely: MRO revenue is recurring, relationship-locked, higher-margin than manufacturing, and effectively immune to new order delays. It is the earnings floor — the revenue that keeps flowing regardless of whether the next platform contract is signed on time or three years late.
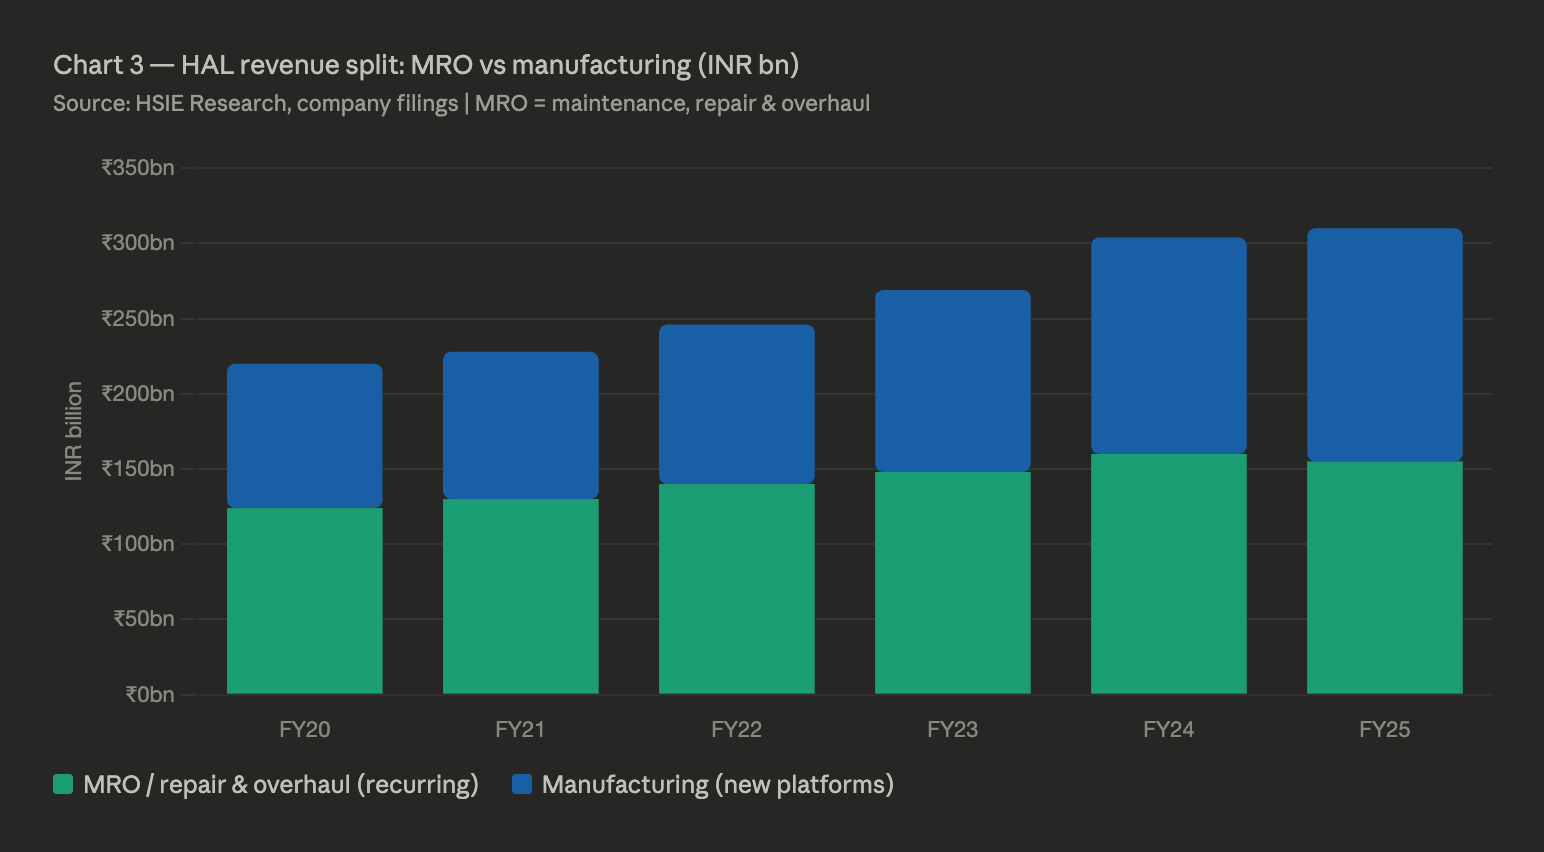
Chart showing MRO consistently at 45–55% of revenue, manufacturing at 35–45%. HAL’s MRO business has contributed 45–55% of total revenue consistently — providing a recurring base that manufacturing volatility cannot erode.
HAL’s MRO business has contributed approximately 50% of total revenue for several years running — and it carries higher margins than the manufacturing segment. The reason is structural: every aircraft or engine HAL has ever built returns for scheduled maintenance, overhaul, and upgrades on a predictable cycle. HAL has built over 4,200 aircraft and 5,200 engines in its history. That installed base is a captive, recurring revenue stream that compounds with every new platform inducted into service.
The MRO margin premium exists because the revenue is sole-source. HAL is the only entity with the technical data package, tooling, and certifications to overhaul the aircraft it has built. Foreign competition is structurally excluded — not by policy mandate, but by technical lock-in.
For BEL, the equivalent is Annual Maintenance Contracts on deployed systems — Akash missile batteries, LRSAM installations, radar networks. BEL’s service revenue grew at 14.1% CAGR during FY15–25, reaching INR 22 billion, and is expected to compound at 15% through FY28E as more systems enter the AMC cycle.
The signal to watch: A rising MRO percentage in HAL’s revenue mix signals fleet maturity — more platforms in active service, more maintenance cycles compounding. A declining MRO percentage signals that new platform manufacturing is ramping — also positive, but different in its implications for earnings quality and consistency.
Metric 4 — Indigenisation Percentage: The Leading Indicator of Margin Expansion
What it is: The proportion of a company’s revenue or product content derived from indigenously designed and manufactured components — as opposed to imported or licensed foreign technology.
Why it’s a leading indicator: When indigenisation percentage rises, margin expansion follows — typically with a 1–2 quarter lag — because the shift from imported to indigenous removes royalty payments, eliminates forex exposure, and allows the company to capture the full IP-to-production margin.
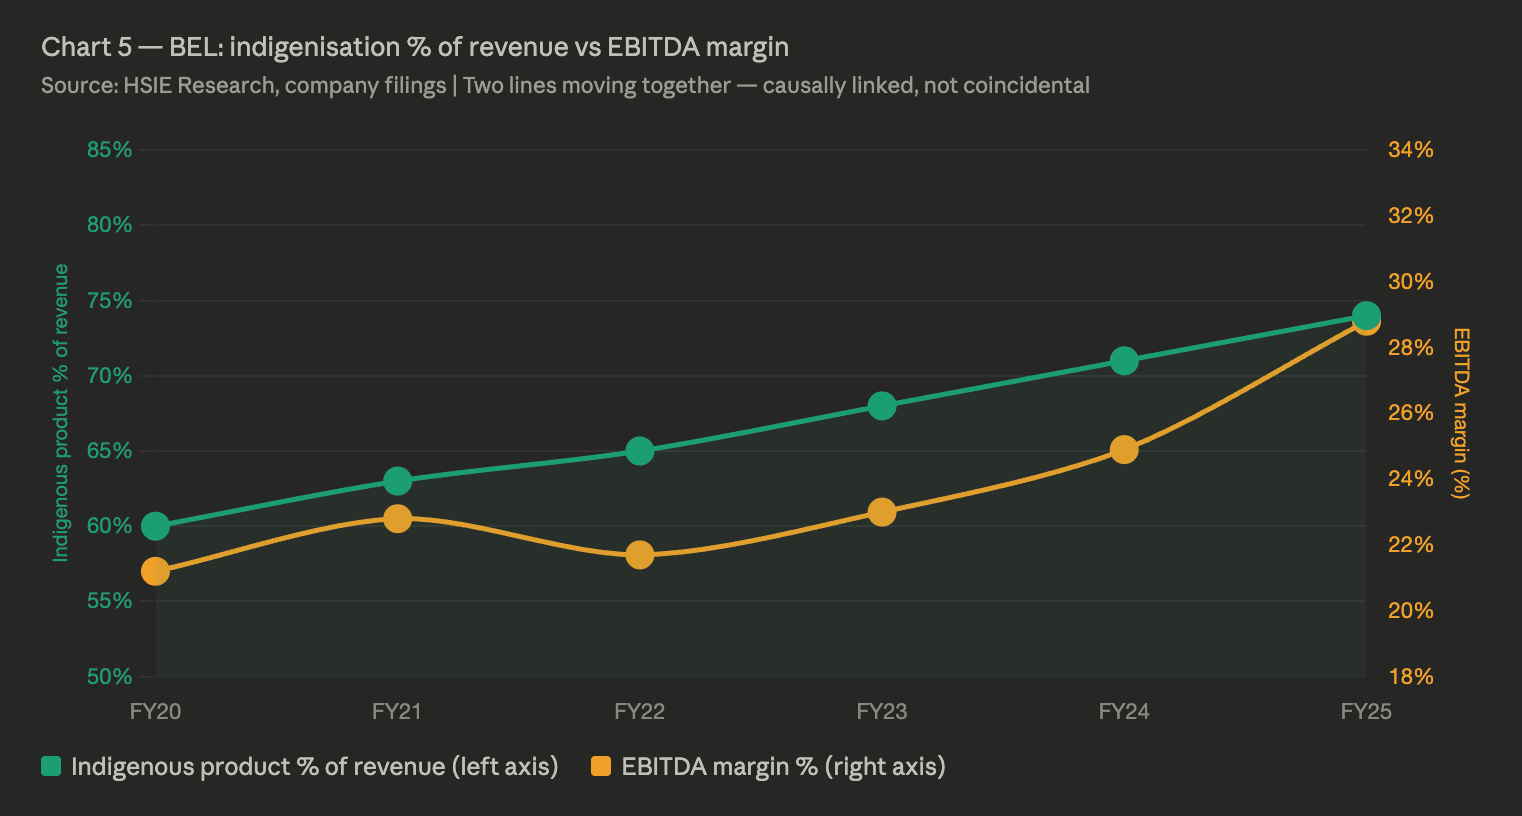
Indigenous product % of revenue (60% in FY20 to 74% in FY25), EBITDA margin (21.2% in FY20 to 28.8% in FY25). Two lines moving together.
BEL’s rising indigenisation % and rising EBITDA margin are not coincidental — they are causally linked. Source: HSIE Research, company filings.
BEL’s indigenous product revenue as a percentage of total revenue grew from approximately 60% in FY20 to 74% in FY25. Over the same period, EBITDA margin expanded from 21.2% to 28.8%. These two lines move together because they are causally linked — not correlated by coincidence.
The investment framework this implies: when evaluating a defence company, track the indigenisation percentage across quarters. A company reporting consistent improvement in this metric — even before the margin expansion is visible in the P&L — is building a future margin tailwind that the market has not yet fully priced.
For Data Patterns, the equivalent metric is the production order percentage — the proportion of its orderbook that has moved from developmental (low margin) to production phase (high margin). As that percentage rises from 53% in FY25 toward an estimated 71% in FY28E, the margin profile improves structurally even without any new contract wins.
Metric 5 — Customer Advances: Why Defence PSU PAT Margins Seem Impossibly High
What it is: Advance payments received from the Ministry of Defence against contracts — collected at contract signing and at milestone achievement — which sit on the company’s balance sheet earning interest income.
Why it confuses retail investors: Defence PSUs consistently report PAT margins that seem too high for capital-intensive manufacturing companies. HAL earns 17–18% PAT margins. BEL earns 21–22%. These numbers would be exceptional in any other manufacturing sector.
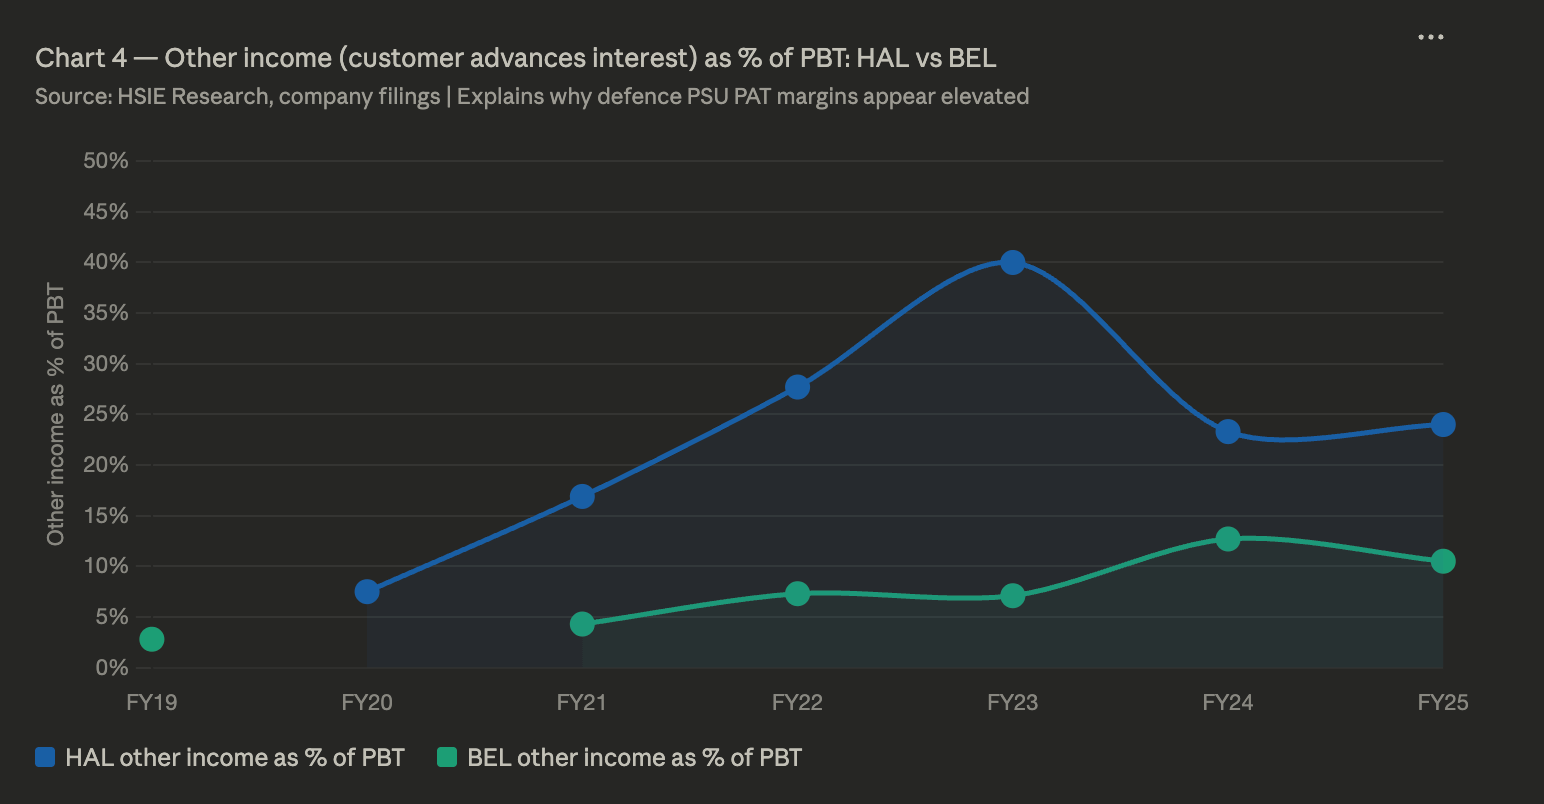
HAL other income as % of PBT rising from 7.5% (FY20) to 24% (FY25). BEL other income as % of PBT rising from 2.8% (FY19) to 10.5% (FY25).
Customer advances generate interest income that materially inflates PAT above operating performance. This is structural, not accidental. Source: HSIE Research, company filings
The explanation is customer advances. HAL held INR 248 billion of customer advances on its balance sheet at FY25-end — growing at 14.5% CAGR during FY20–25 despite revenue CAGR of only 7.6% over the same period. This cash pile earns interest. By FY25, HAL’s other income — primarily interest on customer advances and investments — had grown to represent 24% of PBT, up from 7.5% in FY20. BEL’s other income grew from 2.8% to 10.5% of PBT over the same period.
This is not manipulation or an accounting quirk. It is a structural feature of how government defence contracts work. MoD pays significant advances to enable companies to procure long-lead materials and build working capital buffers for complex programmes. The advances are repayable through delivery milestones. In the meantime, they generate interest income that boosts reported PAT.
The investment implication is twofold. First, when comparing PAT margins across defence companies — or between a defence PSU and a private sector peer — always strip out other income and compare EBIT margins. Second, when a large new contract is awarded, watch for a step-up in customer advances on the balance sheet in subsequent quarters — that advance represents future revenue commitment by the government, and the interest it earns improves near-term PAT even before a single unit is delivered.
Putting the Framework Together
Here is how these five metrics work as a system — not in isolation.
When you find a high book-to-bill, immediately check the execution rate. If execution is lagging, the book-to-bill is telling you about potential, not imminent earnings. When you find high PAT margins, strip out other income and look at EBIT margins — the operating story may be different from the headline PAT story. When you find rising indigenisation percentages, expect margin expansion to follow in 1–2 quarters. When you find a rising MRO percentage, recognise that earnings quality is improving — more recurring, less lumpy.
The companies that score well across all five metrics simultaneously are the ones that deserve premium valuations. BEL — efficient execution (3.0x book-to-bill, 33% execution rate), rising indigenisation (74%), expanding MRO AMC base, and robust customer advance position — is exactly this profile.
Next post: HAL has India’s largest order book at INR 2.4 trillion. Here’s the uncomfortable reason why Fund managers arent buying it— and what it tells you about how to think about valuation in this sector.
If this is useful to you, subscribe, share and follow along.