There is a number buried inside India’s FY27 Union Budget that deserves more attention than it gets.
INR 2.2 trillion.
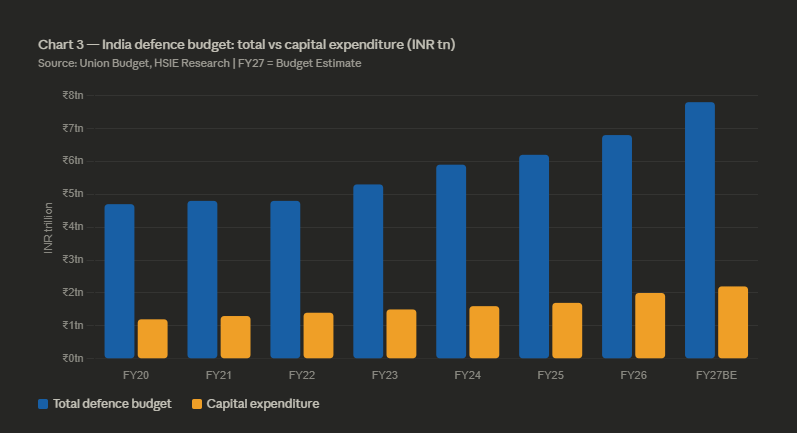
That is India’s defence capital expenditure allocation for FY27 — the portion of the defence budget dedicated to buying new capability.
New aircraft.
New submarines.
New missile systems.
New radar networks.
New drones.
It represents 28% of the total INR 7.8 trillion defence budget, and it grew 15% year-on-year.
For context: INR 2.2 trillion is approximately USD 25 billion of new defence procurement. In a single year. From a single customer — the Ministry of Defence — flowing into a domestic industrial ecosystem that is still, by most measures, in the early stages of being built.
That is the number that should anchor every conversation about Indian defence stocks. Not the headlines about geopolitical tensions (though those matter). Not the political narrative around AtmaNirbhar Bharat (though that has teeth). The INR 2.2 trillion capex line is the concrete, budgeted, annual demand signal for an entire sector.
I just went through a 280+ page report by HSIE and I’m trying to build the full picture around it. First, lets go global.
The Global Context: A Structural Reset, Not a Cyclical Spike
Global military expenditure reached USD 2,653 billion in 2024.
The number itself is less important than the trajectory behind it.
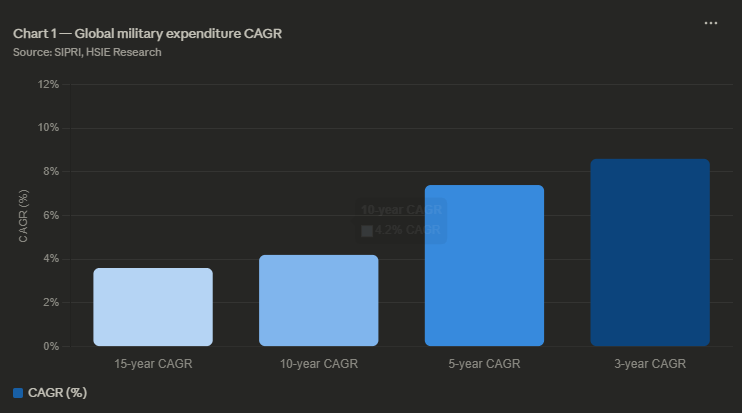
The 15-year CAGR of global defence spending was 3.6%. The 10-year CAGR was 4.2%. The last 3-year CAGR has accelerated to 8.6% — more than double the long-run average.
Industry projections put global defence spending at a 5% CAGR through 2030, reaching USD 3,555 billion. That is well above projected global GDP growth, meaning defence is taking a structurally larger share of sovereign spending worldwide.
Why?
The simplest answer: conflicts are not resolving. They are multiplying and persisting.
There are currently 45 active armed conflicts in the Middle East and North Africa, 35 in Africa, 21 in Asia, and 7 in Europe. Russia-Ukraine conflict has now entered its fourth year. The Israel-Iran confrontation has expanded in scope. India faces active border friction on two fronts simultaneously — with Pakistan and with China.
A more nuanced answer: the character of warfare itself has changed, and that change is expensive.
The Ukraine conflict established something that military planners will be digesting for the next two decades — that cheap, mass-produced, software-upgradeable drones can achieve tactical outcomes previously reserved for platforms costing 100 to 1,000 times more. A $500 first-person-view drone can disable a $2 million armoured vehicle. A swarm of loitering munitions can suppress an air defence system that cost hundreds of millions to deploy.
The response from every major military: rebuild doctrine, procurement priorities, and industrial capacity around electronics-intensive, software-defined, rapidly-iterable systems. That rebuilding costs money. Significant, sustained, multi-year money.
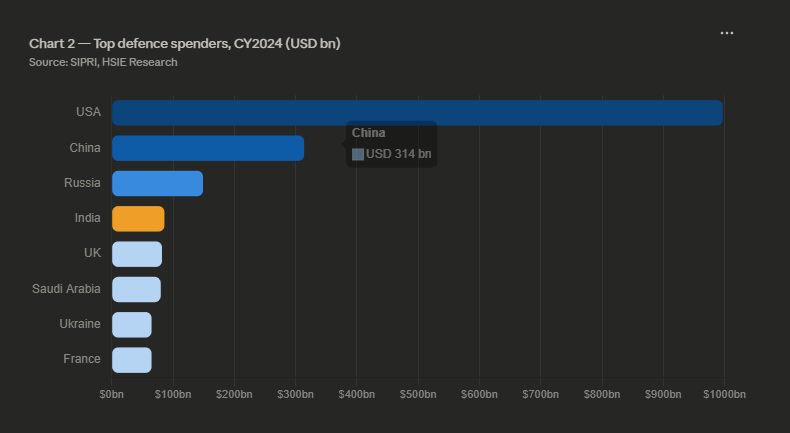
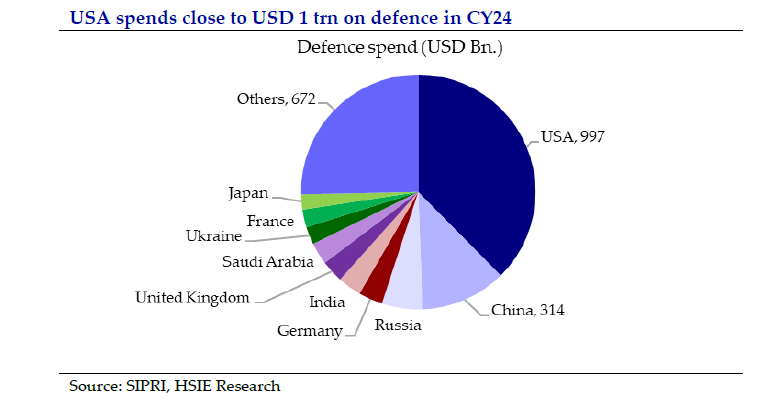
The USA spent $997 billion on defence in 2024 — roughly 37% of all global military expenditure at 3.4% of GDP. Europe’s combined defence budget surged 17% in a single year to $693 billion, driven by NATO members scrambling to meet the 2% GDP commitment that Russia’s invasion made non-negotiable. Ukraine itself spent 34% of its GDP on defence in 2024.
This is not a temporary spike driven by one conflict. This is a generational reset of what sovereign security costs.
India’s Position: The Import-to-Export Transition
Within this global backdrop, India’s story has a specific and genuinely differentiated quality.
India was the world’s largest arms importer in 2019-23, accounting for 9.8% of all global arms imports. Russia was the dominant supplier at 55% share in 2015-19, declining to 36% in 2020-24 as sanctions, supply chain stress, and Ukraine war capacity diversion forced India to diversify toward France (Rafale, Scorpene submarines) and the USA (P-8I maritime patrol aircraft, MH-60R helicopters).
That import dependence is now being structurally dismantled.
The data is unambiguous. India’s defence production crossed INR 1,540 billion in FY25 — a record. Indigenous defence production reached INR 1,274 billion in FY24, a 174% increase from INR 464 billion in FY15. Sixteen thousand MSMEs are now active participants in the defence supply chain. Two dedicated defence industrial corridors — in Uttar Pradesh and Tamil Nadu — are operational.
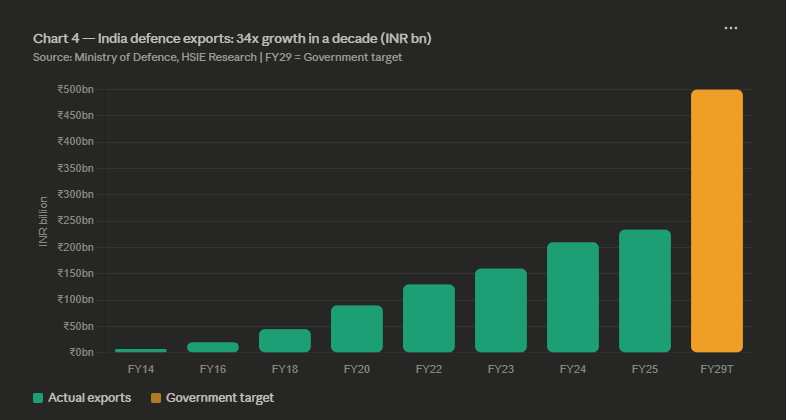
Most strikingly: India’s defence exports grew from INR 7 billion in FY14 to INR 234 billion in FY25. That is a 34x increase in one decade. The government’s target of INR 500 billion in exports by FY29 would represent another doubling from here.
This import-to-export transition is not just a geopolitical aspiration. It is backed by hard policy mechanisms:
Import bans on 209 weapon categories and 351 subsystems, phased between 2023 and 2029, mean domestic companies face no foreign competition for an expanding list of contracts. The DAP-2020 procurement framework gives the highest priority to indigenously designed, developed, and manufactured products — structurally redirecting contract awards toward domestic players. The SRIJAN portal has listed 4,666 items for indigenisation, of which 2,972 have already been completed, with DPSUs placing orders worth INR 75.7 billion on Indian vendors in three years.
The Technology Layer: Why Electronics Companies Win Disproportionately
Here is the insight that changes how I think about which companies benefit most.
Modern defence platforms — fighter aircraft, destroyers, missile systems, submarines — are increasingly electronics systems that happen to have a metal chassis.
Electronics now account for approximately 40% of the value of a major defence platform. That share is rising as AESA radars, electronic warfare suites, network-centric command and control systems, satellite-based ISR, and AI-enabled targeting become central to every platform’s capability.
The investment implication: the companies building the radar, the electronic warfare suite, the avionics system, and the missile seeker are capturing a structurally growing share of the total platform value — regardless of who manufactures the airframe or the hull.
India has exactly these companies. They are listed. They have deep relationships with DRDO and the armed forces. They carry order books extending 3 to 7 years forward. And they operate in a segment that is explicitly protected by indigenisation mandates.
The global comparison validates the premium. Look at what markets have done to electronics-intensive defence companies globally: Rheinmetall’s stock is up 1,874% over 5 years. SAAB AB is up 1,063%. These are not coincidences — they are markets pricing the structural shift toward electronics-intensive warfare capability.
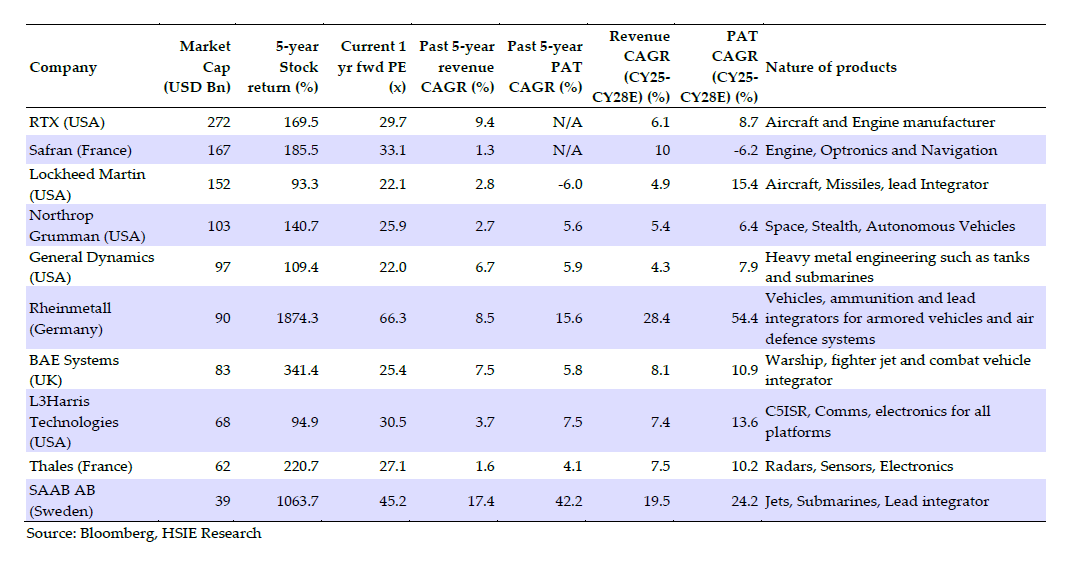
India’s equivalent companies are earlier in that journey. Much earlier. Which is where the opportunity sits.
What This Series Covers
Over the next few weeks, I am going to build a complete investment framework for India’s defence sector — grounded in data, not narrative.
We will map the full value chain: who sits where, what margins look like at each layer, and where the structural pricing power actually lives.
We will cover the financial framework: how to read a defence company’s order book, book-to-bill ratio, MRO lifecycle revenue, and indigenisation margin impact — the metrics that professional investors use that most retail analysis ignores.
Will also see a direct comparison between few of the companies, — India’s dominant DPSU electronics integrator versus its most sophisticated private sector challenger. The margin gap between them tells a story about where value is migrating in this sector.
We will also include a take on the most interesting contrarian question in the sector: HAL carries India’s largest defence order book at an estimated INR 2.4 trillion.
Will also cover Mission Sudarshan Chakra — the umbrella national programme announced in August 2025 to build India’s layered air and missile defence shield. The procurement associated with it is potentially INR 1-2 trillion over a decade. Understanding who benefits requires understanding the programme architecture in detail.
Then will bring it together into a portfolio construction framework — how to size exposure, which segments to weight, and what the risk factors are that could break the thesis.
This series is based on detailed analysis of HSIE’s 286-page institutional defence sector report published in March 2026 — the kind of primary research that typically sits behind institutional pay walls and informs fund manager decisions before retail investors have framed the question.
The goal is not stock tips. It is a durable framework for thinking about a sector that will be a significant part of India’s equity market story for the next decade.
If that is useful to you, subscribe and follow along.
Next post : The defence value chain map — and why the company building the radar earns more than the company building the aircraft.