The most analytically interesting fact about Indian depositories isn’t in the earnings model. It’s in two numbers read side by side: CDSL holds 82% of all demat accounts in India. NSDL holds 86% of all demat value. Same industry. Same SEBI licensing. Same core product. Polar opposite businesses.
Most coverage treats this as a footnote. I want to argue it is the entire story — because understanding what caused this split, and what it means for how each business compounds forward, changes your view on which one to own, at what price, and with what risk tolerance.
In Post 1 of this series, I laid out the macro canvas: India at 13.4% demat penetration heading toward developed-market levels, MF AUM at 20% of GDP, SIP inflows compounding at 21% annually. All of that structural tailwind flows through CDSL and NSDL before it reaches investors. Today I want to open the hood — look at how each business actually earns its money, what the risks are that their current valuations don’t price, and what this split-screen means in practice.
How a depository actually earns: the Rs100 unit economics
Before the comparison, let me show you how the business works at the most granular level. Industry research on the depository model has a remarkably clean unit economics framework: take a representative retail investor holding five securities in a demat account, making roughly twelve trades in a year. What does a depository earn from that one investor?
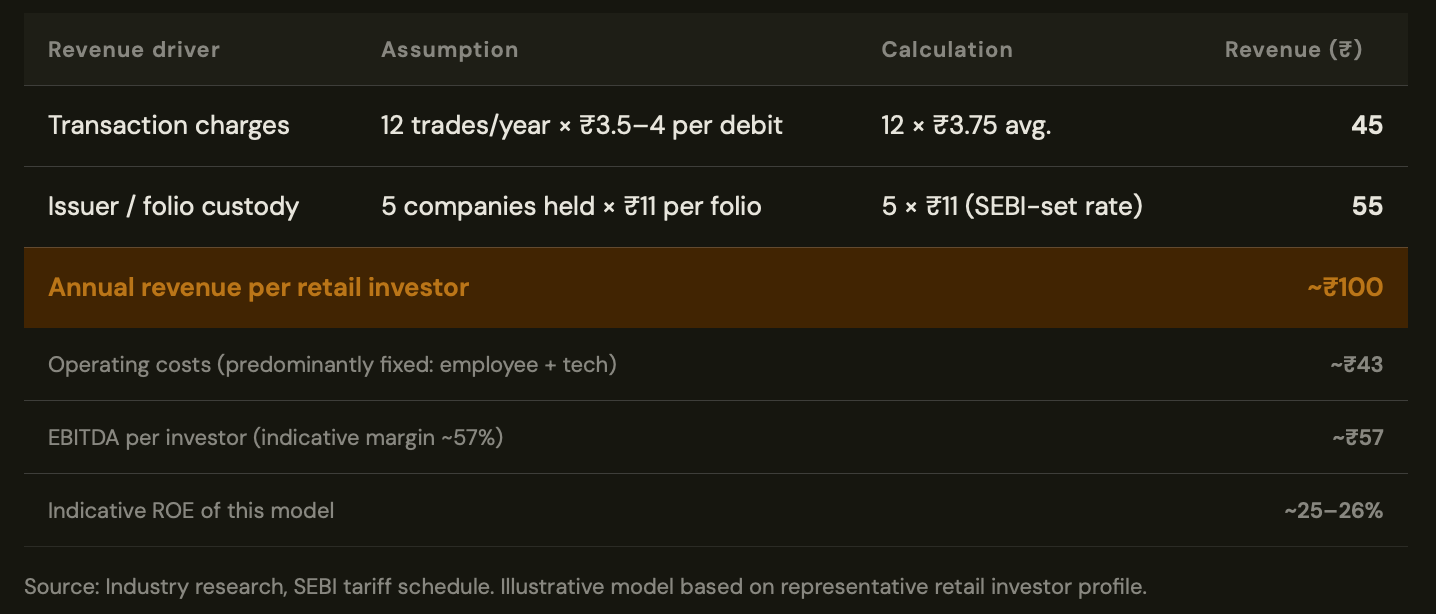
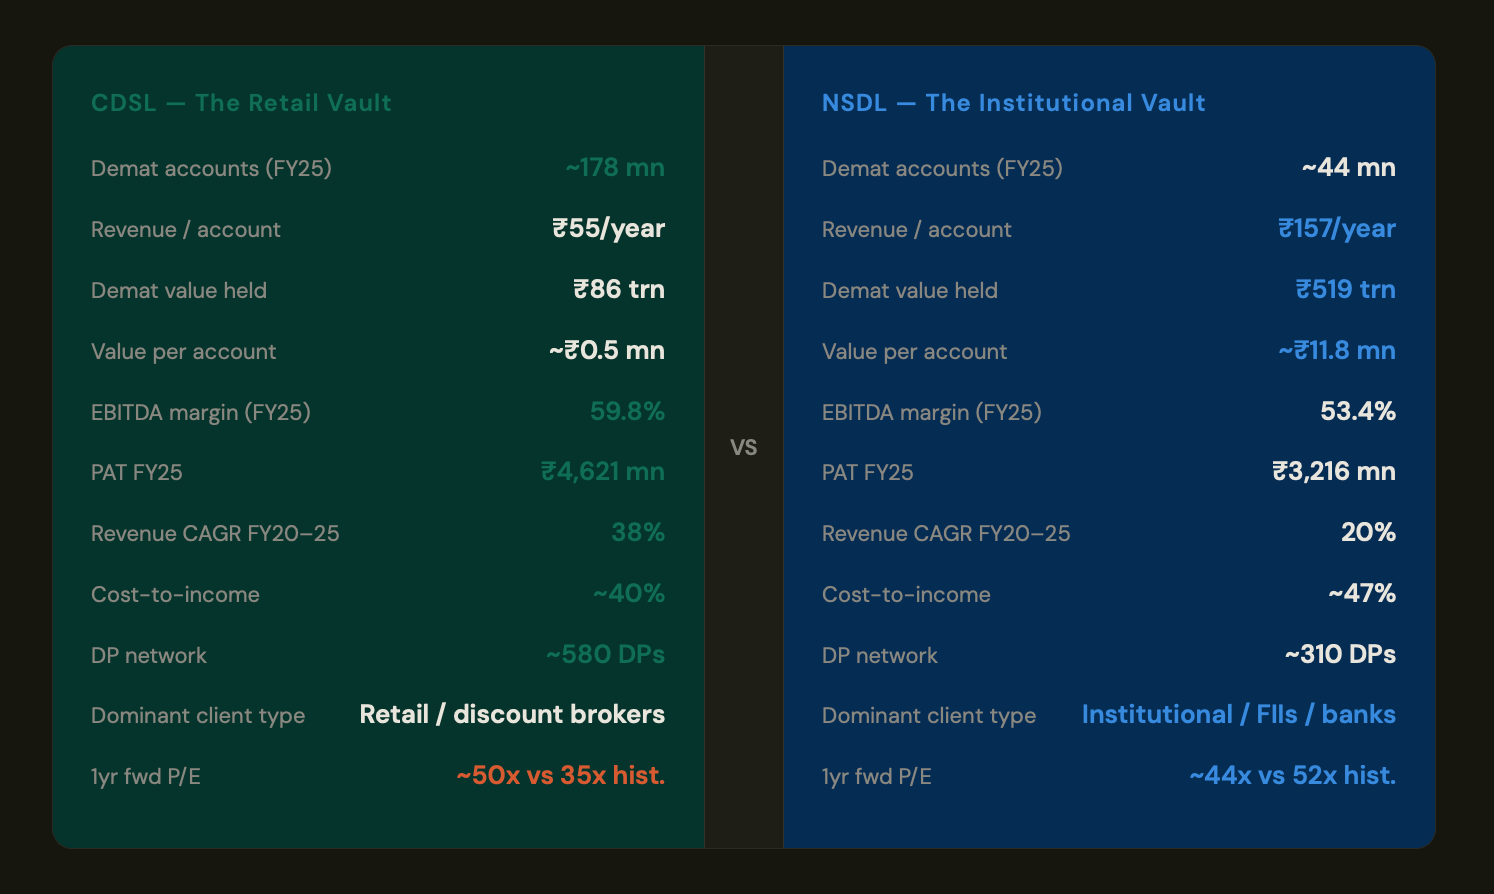
That Rs100 number is the atomic unit of the depository business. Now here is where the CDSL vs NSDL split becomes analytically sharp: CDSL earns approximately Rs55 per account per year. NSDL earns approximately Rs157.
NSDL earns nearly 3x more per account. With a fraction of the accounts. Let that sink in before you reflexively reach for CDSL as the growth play.
How the split happened: the discount broker revolution
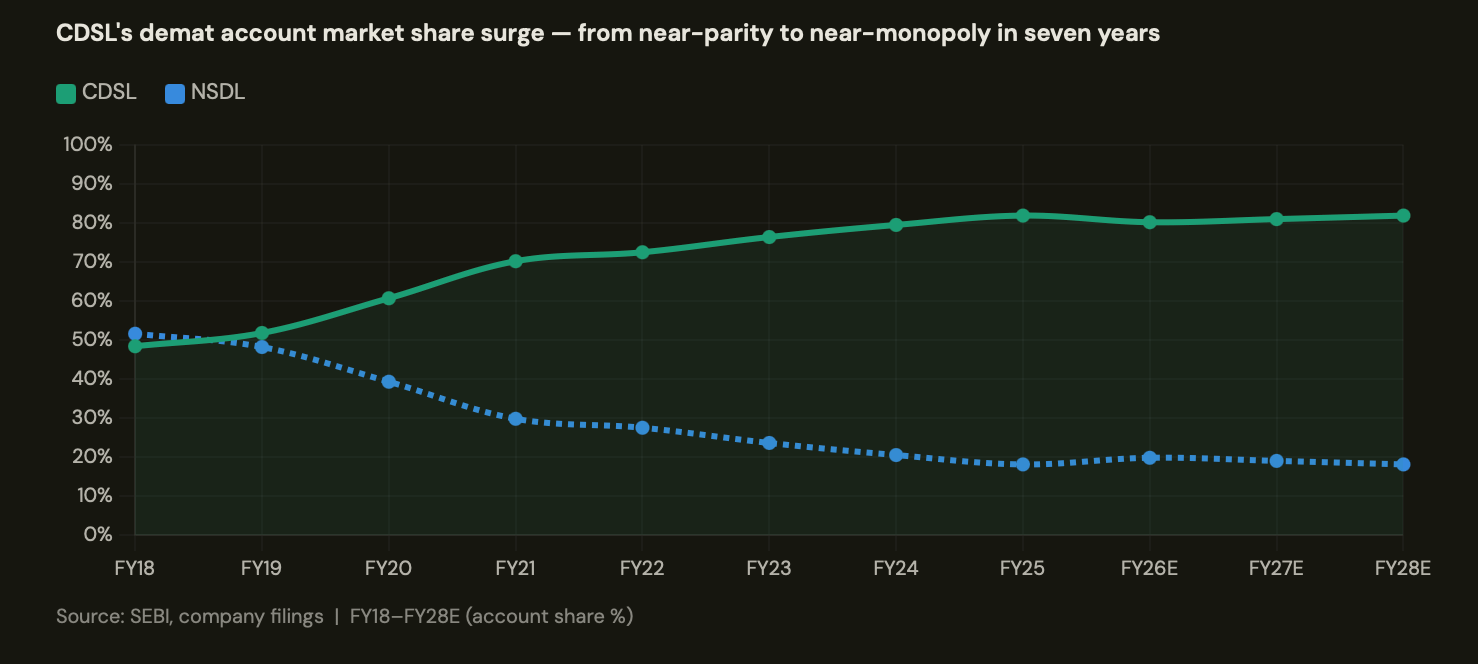
In FY18, CDSL held 48.4% of demat accounts. NSDL held 51.6%. The two depositories were roughly equal. By FY25, CDSL had surged to 81.9% while NSDL had retreated to 18.1%.
What happened in between was one of the sharpest competitive dislocations in recent Indian financial history — and it had nothing to do with the depositories themselves.
Zerodha launched in 2010 but truly scaled post-2015. Groww, Upstox, Angel One followed. These discount brokers needed a depository partner that was digital-native, API-friendly, and agile. CDSL fit that profile. NSDL’s architecture was designed for institutional custodians — robust, heavyweight, and not optimised for onboarding a retail investor in three minutes on a smartphone.
The post-COVID demat explosion of FY21–FY24 amplified this dynamic enormously. Monthly demat additions ran at 3+ million at peak. Virtually all of those went to CDSL. Account share moved from 70% in FY21 to 82% by FY25.
NSDL wasn’t sleeping — it recently expanded partnerships with fintech brokers and its incremental account share has started recovering (from 9% in FY25 to ~15% in early FY26). But the structural client-mix difference isn’t going to close quickly. The average CDSL account holds approximately Rs0.5 mn in securities. The average NSDL account holds approximately Rs11.8 mn — almost 24x more.
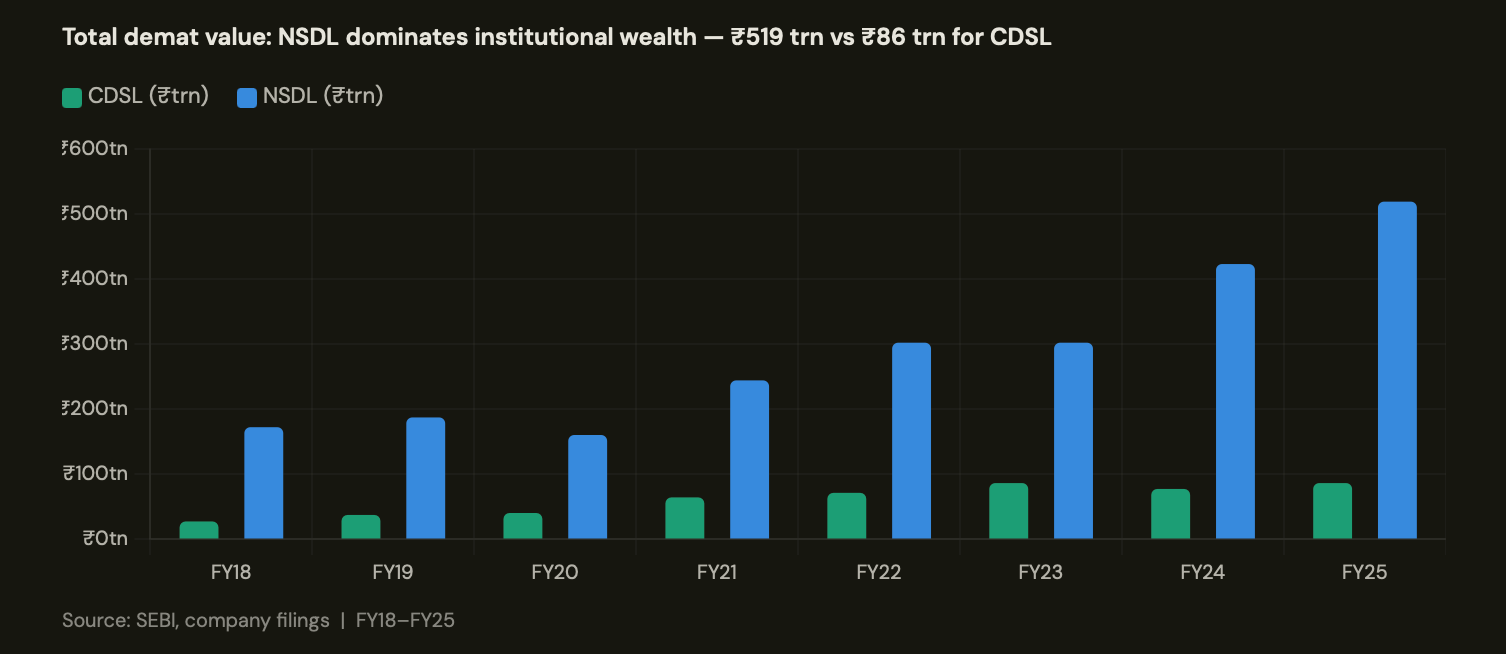
Read the above graph carefully. NSDL’s demat value has grown from Rs 172 trn in FY18 to Rs 519 trn in FY25, tracking the rise of institutional and FII holdings in Indian equity. CDSL has grown from Rs27 trn to Rs86 trn in the same period — remarkable growth, but still only 14% of total system value. The institutional money lives at NSDL, and institutional clients don’t switch depositories on a whim. The switching cost — re-filing, integration work, operational disruption — is a genuine moat that doesn’t show up in any financial model.
“CDSL won the battle for breadth. NSDL retained the war for depth. The question for investors is which metric matters more over the next five years — and whether the current price premium on CDSL is justified.”
Revenue mechanics: who earns what and how
Both depositories earn from two broad buckets. Recurring (annuity-like) revenues: annual issuer custody fees charged to companies at Rs11 per folio per year — SEBI-set, non-negotiable. Transactional revenues: settlement charges on every debit instruction from a demat account, IPO processing fees, and corporate action charges.
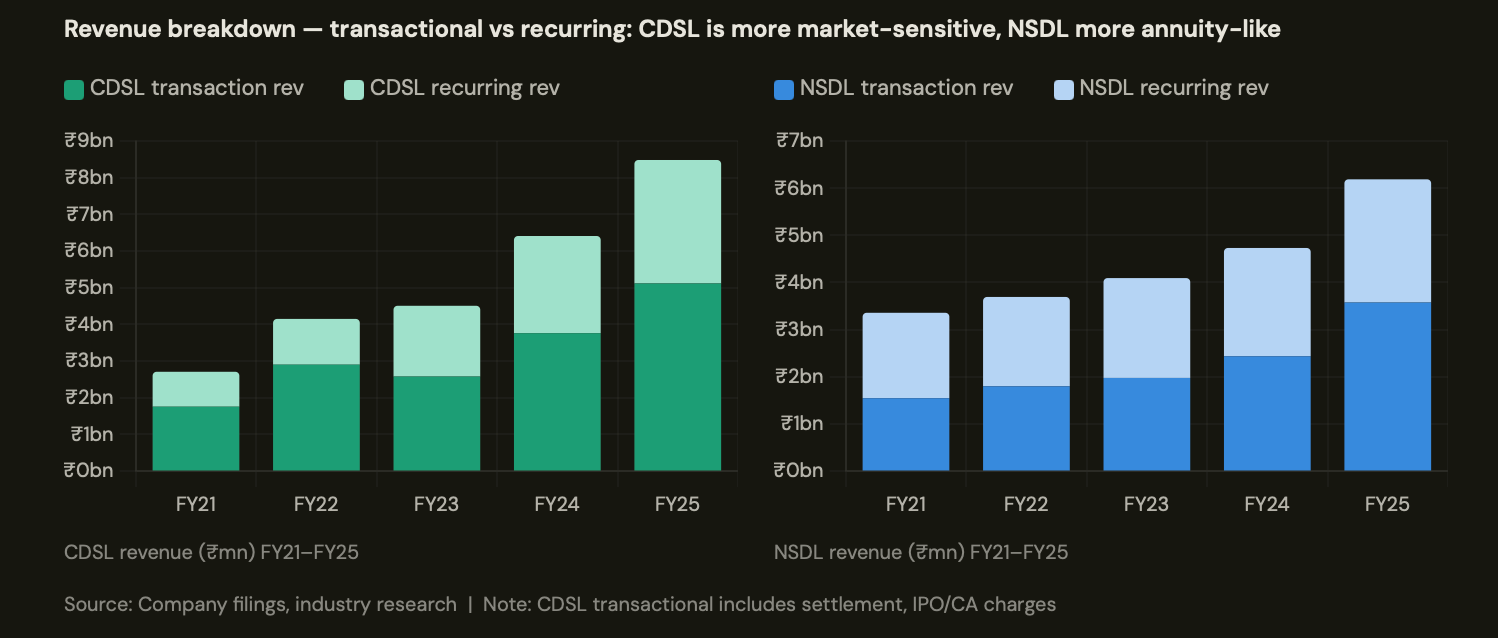
The revenue mix reveals something important that headline numbers obscure. CDSL earns roughly 60% of its standalone revenues from transactional sources — settlement charges, IPO fees, corporate actions. NSDL earns approximately 42% from transactions, with a larger recurring base from issuer custody charges.
This makes CDSL meaningfully more sensitive to market activity. A year of muted trading (like FY23 when equity turnover fell 20%) hits CDSL harder than NSDL. Conversely, a year like FY22 or FY24 with high trading volumes and IPO activity disproportionately benefits CDSL. The Rs 38 EPS CAGR over FY20–25 was partly structural (account growth) and partly cyclical (exceptional market activity). The question at 50x P/E is how much of that CAGR was the tailwind — and how much was the business.
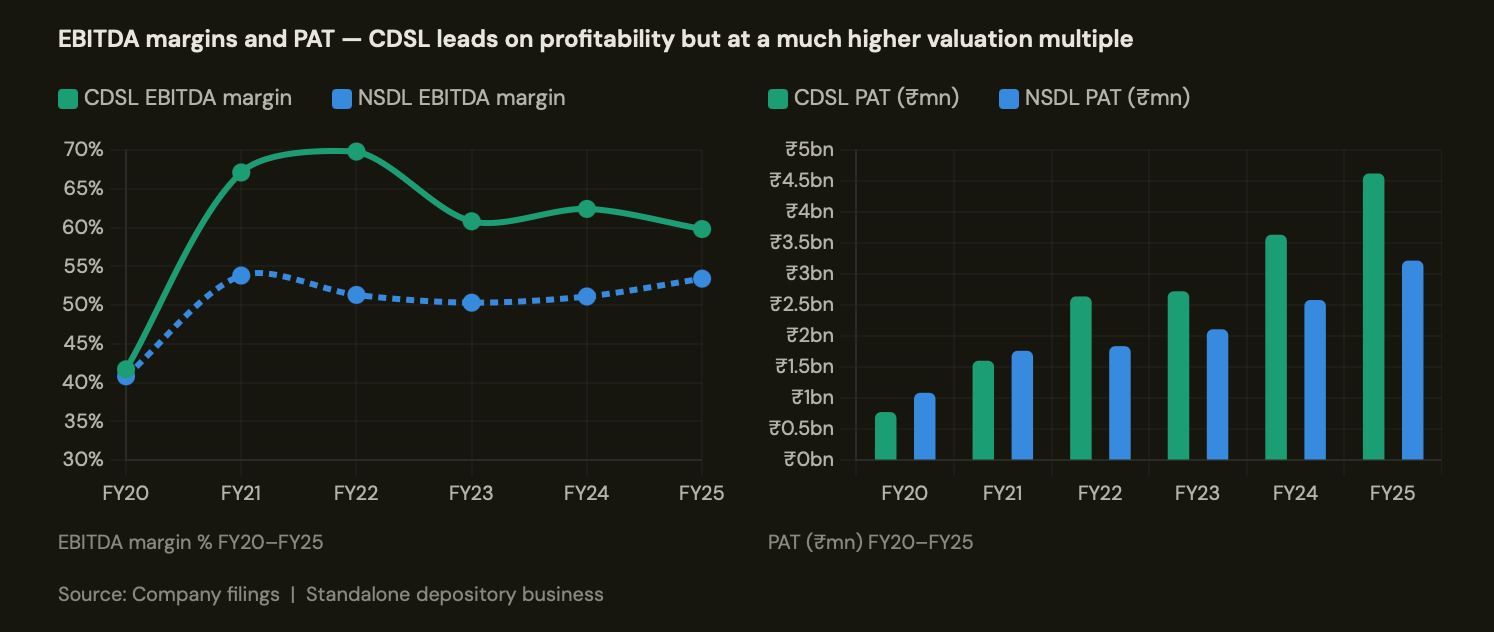
CDSL’s EBITDA margin of 59.8% in FY25 versus NSDL’s 53.4% is partly structural — CDSL’s retail-heavy model drives higher transaction volume per rupee of fixed cost, and its simpler platform architecture keeps technology spend lower (~10% of revenues vs ~12% for NSDL). The cost-to-income ratio tells the same story: CDSL at 40% vs NSDL at 47%.
CDSL’s PAT of Rs4,621mn versus NSDL’s Rs3,216mn in FY25 is the result of a 5-year revenue CAGR of 38% vs 20%. But here is the reversion-to-mean question: can CDSL sustain 38% revenue CAGR in a more normalised market environment? Research consensus expects 15% EPS CAGR for both depositories over FY26–28E — a sharp deceleration from the FY20–25 pace. At 50x P/E, CDSL is priced as if the exceptional years continue. At 44x P/E, NSDL is — unusually — trading below its own historical mean multiple of approximately 52x.
The IPO engine: a structural tailwind with a timing risk
One revenue line that both depositories benefit from enormously is IPO-related charges. Issuers pay depositories to admit securities into the system, and every IPO generates processing and allotment fees. The pipeline over FY20–FY25 was extraordinary.
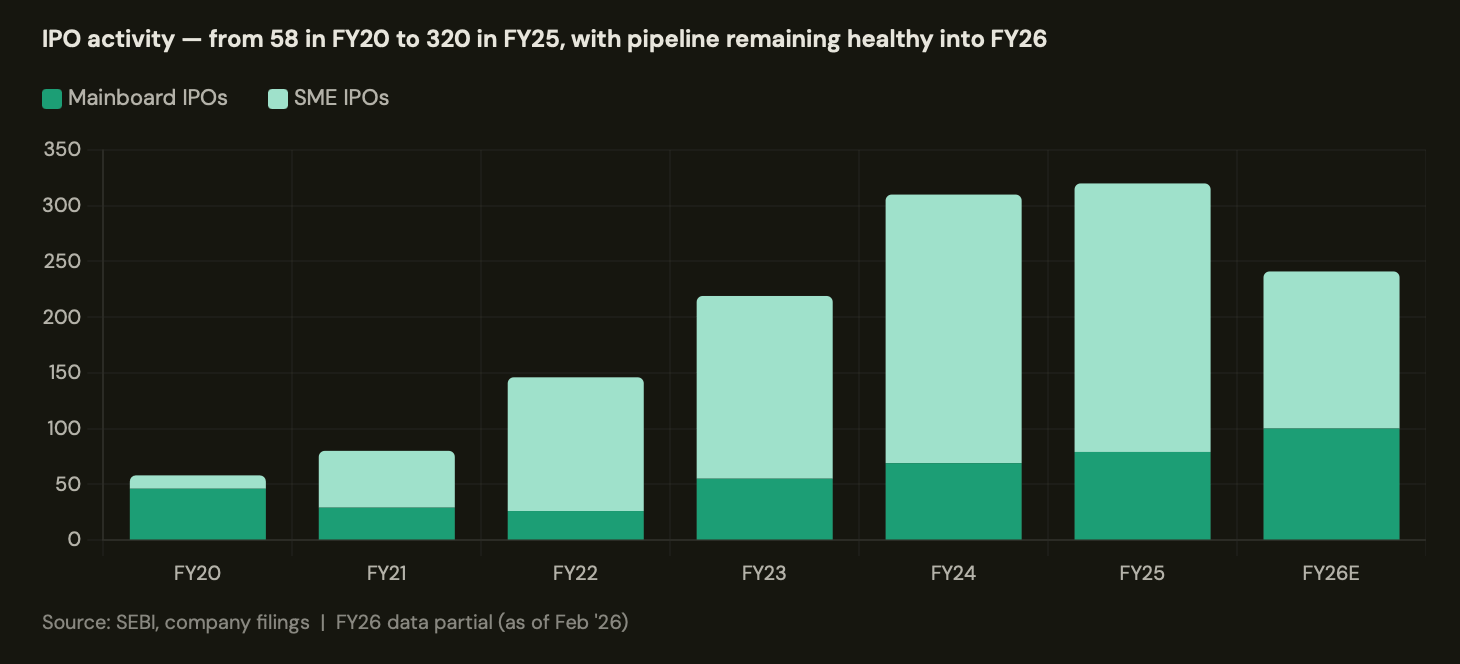
Total IPOs jumped from 58 in FY20 to 320 in FY25. SME IPOs — which also generate issuer fees — have accelerated significantly. Research projects CDSL’s IPO and corporate action revenues at ~16% CAGR over FY26–28E; NSDL’s on a lower base at ~28% CAGR. The IPO pipeline remains healthy but has moderated from the FY24–25 peak, with SEBI’s scrutiny on SME listings adding a regulatory dampener.
The structural driver underneath IPO growth is the regulatory push on unlisted company dematerialisation. This is also where a specific risk sits — which I’ll cover next.
The two risks the market is underweighting
Both depositories carry risks at current valuations that I think sell-side coverage handles gently. I want to name them plainly.
Risk 1: The MCA small-company exemption — the quiet toll reduction nobody is modelling properly.
One of the largest structural growth drivers for depository issuer fees over the last five years was mandatory dematerialisation of unlisted private companies — a regulatory push that added tens of thousands of companies to the demat system. NSDL onboarded unlisted company registrations that grew from 35,000 in March 2024 to 97,000 by February 2026. CDSL went from 15,000 to 37,000 over the same period. That’s a significant compounding of the issuer fee base.
In December 2025, the Ministry of Corporate Affairs revised the definition of a “small company” — raising the paid-up capital threshold from Rs 40 mn to Rs 100 mn, and the turnover threshold from Rs 400 mn to Rs 1 bn. Small companies are exempt from the mandatory dematerialisation requirement.
REGULATORY RISK — MCA SMALL COMPANY THRESHOLD REVISION (DEC 2025)
The revised thresholds significantly expand the universe of companies classified as “small” — and therefore exempt from mandatory demat. A sizeable portion of existing unlisted companies now fall outside the mandatory demat net. New company onboarding — and the associated joining fees and annual custody fees — will slow as a result. This is not a catastrophic risk, but it is a direct headwind to one of the fastest-growing revenue lines for both depositories. NSDL, with a larger unlisted-company franchise (~72% market share of unlisted company demat registrations), faces a proportionately larger impact.
Risk 2: SEBI’s KYC fee rationalisation — a preview of what regulatory repricing looks like in practice.
With effect from April 1, 2026, SEBI rationalised the KYC Registration Agency (KRA) tariff structure. Fetch fees — the charge levied every time a broker queries a KYC record — were reduced from Rs35 to Rs28 per enquiry. Creation fees for new KYC records were cut to Rs5. Annual maintenance charges of Rs0.75 per record per year will only kick in from FY28 onwards, on records created in FY27.
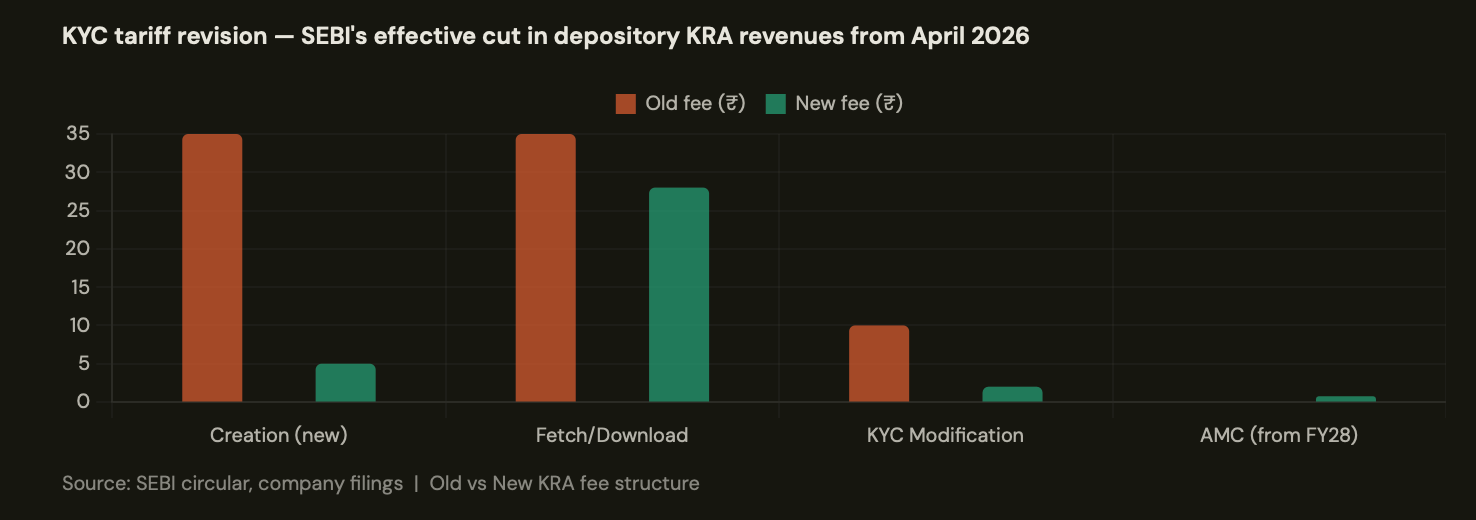
Why does this matter for CDSL specifically? KRA (KYC-related) revenues account for approximately 20% of CDSL’s consolidated revenues — via its subsidiary CVL (CDSL Ventures Limited). The same line contributes only around 6% for NSDL. The fetch-fee cut hits CDSL disproportionately hard. Fetch-related fees account for 70–80% of CVL’s revenues. The AMC relief (Rs0.75/record/year from FY28) is a partial offset, but the gap-year between the fee cut and the AMC revenue accrual creates a near-term earnings hole that research currently estimates will weigh on CDSL’s consolidated margins through FY26–FY27.
THE DEEPER POINT ON REGULATORY RISK
Both fee cuts — MCA small company threshold and SEBI KYC rationalisation — share the same structural character: SEBI and the MCA set prices, not management or the market. The annual issuer custody fee of Rs11 per folio was last revised in 2015. A revision was due in 2020 and was deferred. These businesses do not have pricing power in the conventional sense. Any upside from a tariff revision is a gift from the regulator; any downside is also delivered by the same hand. At 44–50x P/E, the market is priced for the gift while underweighting the downside scenario. That’s the asymmetry I’d be cautious about.
The institutional mix: why NSDL’s client base is stickier than it looks
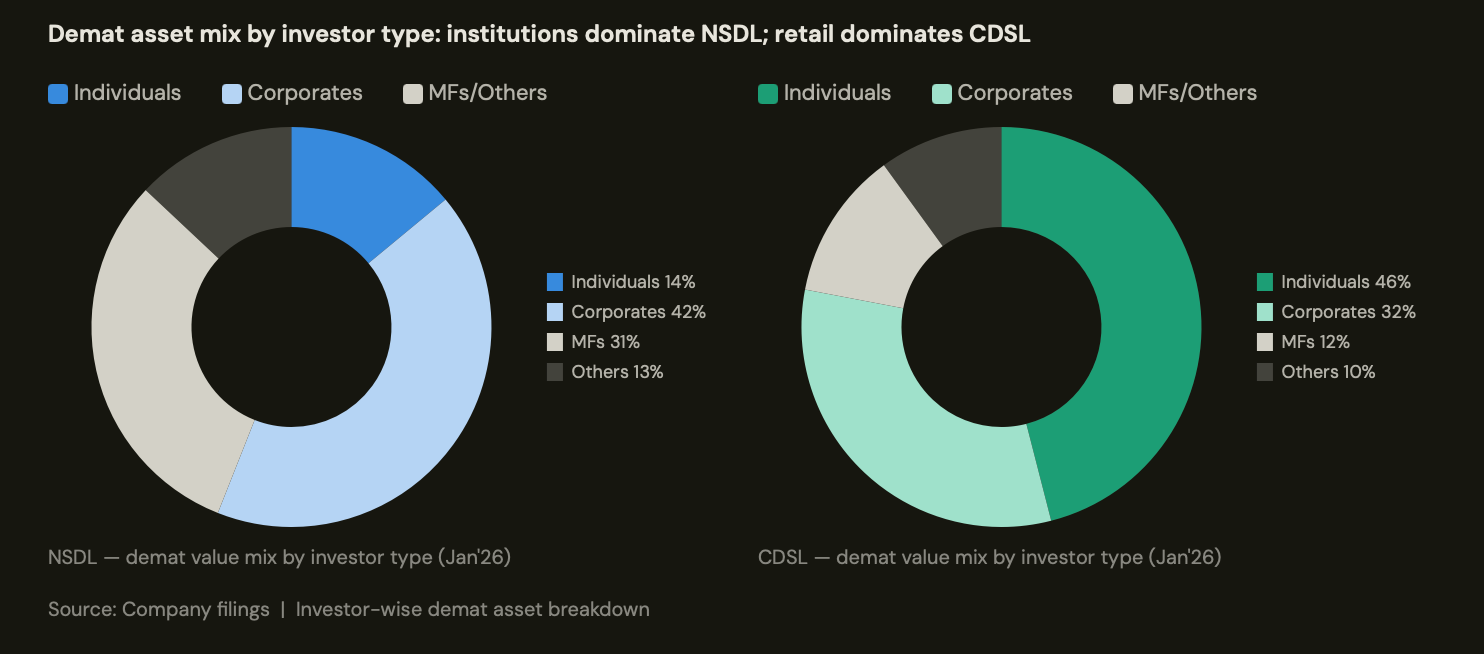
Domestic individuals account for just 14% of NSDL’s demat assets — versus 46% for CDSL. Corporates and mutual funds dominate NSDL at ~55% of total value. FIIs and foreign custodians form a significant portion of the remainder.
From a credit analyst’s perspective, the institutional client base is a different asset class entirely. An FII or a domestic insurance company does not switch depositories because a fintech broker offers a slightly better UX. The switching cost — regulatory re-filing, custodian relationships, settlement infrastructure — creates a de facto captive franchise. NSDL’s institutional base hasn’t needed to sell itself aggressively in two decades. It holds the money that doesn’t move.
The valuation inversion: the contrarian read that research won’t say loudly
Here is the fact that strikes me as the most important pricing signal in this comparison, and the one that gets buried in the footnotes.
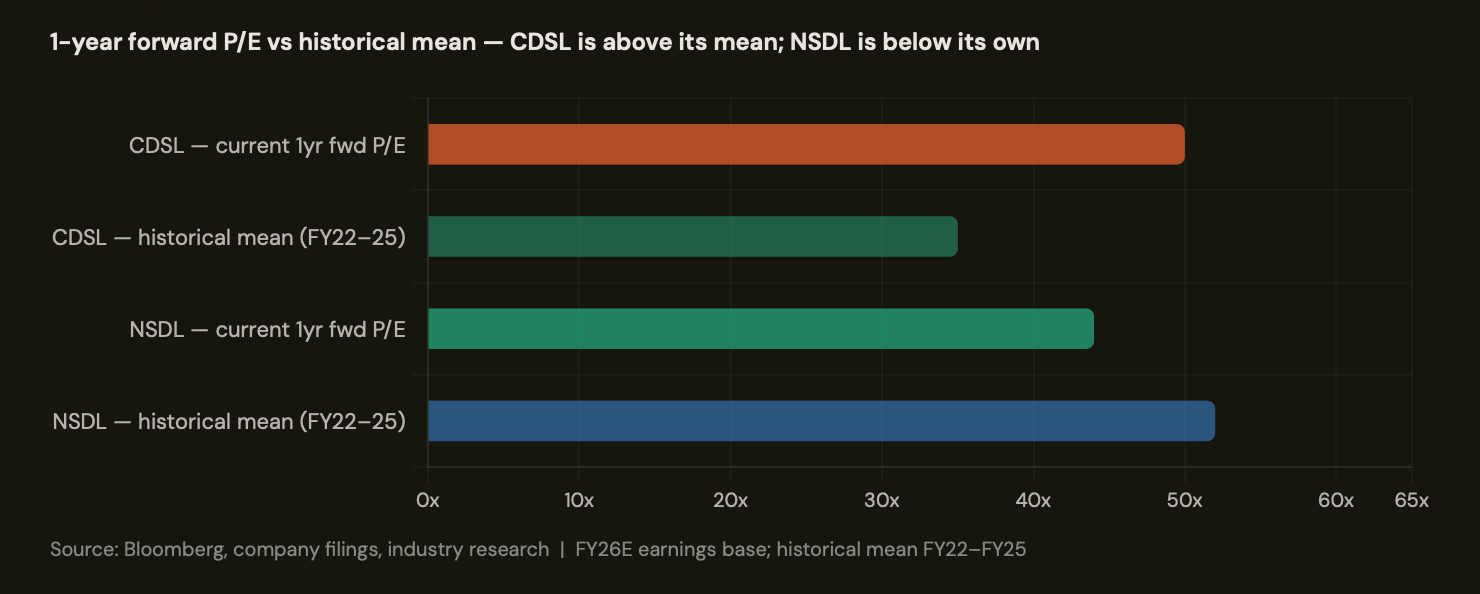
1-year forward P/E vs historical mean — CDSL is above its mean; NSDL is below its own
CDSL trades at approximately 50x one-year forward P/E. Its own historical mean over FY22–FY25 was approximately 35x. It is trading at a 43% premium to its own history.
NSDL trades at approximately 44x one-year forward P/E. Its own historical mean over FY22–FY25 was approximately 52x. It is trading at a 15% discount to its own history.
Both are expected to grow EPS at approximately 15% over FY26–28E — the same pace. One is priced at a significant premium to mean. The other is priced at a discount. The market is paying for CDSL’s growth story (which is largely in the price) and is pricing NSDL as if its institutional franchise is impaired (which it isn’t).
I am not making a blanket bull case for NSDL over CDSL. The institutional franchise doesn’t have CDSL’s operating leverage or the same long-term penetration upside. But at 44x vs 50x P/E, and with NSDL trading below its own historical mean — while both face the same regulatory environment — the relative value is harder to ignore than the consensus “prefer CDSL” view suggests.
“CDSL is the obvious trade. NSDL is the boring one. At current valuations, the obvious trade is in the price. The boring one isn’t.”
My read: the framework before the verdict
I want to hold the full verdict for Post 4, where I’ll put all four companies side by side with the global peer comparison. But I’ll leave you with the framework that I think is the right way to hold both these names.
INVESTMENT FRAMING — DEPOSITORIES AT CURRENT VALUATIONS
CDSL: Correct structural story, cyclically elevated earnings base, trading above historical mean. Best held if you have a 5–7 year view and can tolerate the regulatory volatility. The KYC fee cut is a near-term earnings headwind that 50x P/E doesn’t price. Wait for either a correction to ~35x or earnings clarity on the AMC revenue recovery from FY28.
NSDL: Underappreciated institutional franchise. Trading below historical P/E mean. Lower growth CAGR (15%) is compensated by lower regulatory risk and higher per-account revenue stability. The MCA small-company exemption weighs on joining fees, but core custody revenue remains anchored. At ~44x 1yr fwd P/E, the risk-reward is more balanced than CDSL at current levels.
What neither of these businesses is — at current prices — is cheap. The structural thesis is sound. The penetration runway is real. But the margin of safety that a credit analyst would demand before calling these “no-brainers” doesn’t exist at 44–50x P/E, especially with regulatory pricing risk sitting live in the background. That is the honest read.