If Posts 1 and 2 laid out the structural case for India’s capital market infrastructure, this is where the investment thesis gets sharp. RTAs — Registrar and Transfer Agents — are the businesses that process every mutual fund unit in India. Every SIP deduction. Every NFO allotment. Every redemption. Every folio statement. And unlike depositories, whose pricing is set by SEBI’s tariff schedule, RTAs negotiate their fees B2B with AMCs. That single structural difference changes the risk-reward calculation meaningfully at current valuations.
Two companies share this space: CAMS and KFin. Together they service approximately 98-99% of the Indian mutual fund universe. They are not interchangeable. CAMS is the larger, more stable, more concentrated franchise. KFin is the faster-growing, more diversified, and increasingly international business. Understanding the difference — and what each is priced for — is the analytical work of this post.
What an RTA actually does — and why it’s better than being a depository
A Registrar and Transfer Agent maintains the official investor register for a mutual fund. Every time a SIP is processed, a folio is created, a switch is executed, or an investor changes their address — it flows through the RTA’s system. The RTA is the keeper of truth for mutual fund ownership in India. No transaction is final until the RTA has recorded it.
This sounds operational and unglamorous. It isn’t. The switching cost for an AMC to change its RTA is enormous — migration of millions of folios, regulatory re-filings, operational disruption, and the risk of investor servicing failures during the transition. In practice, AMCs do not switch RTAs. CAMS has held roughly 67% of MF AUM under service for years. The stickiness of this business is closer to a regulated monopoly than a competitive market — even though it is technically competitive.
Now compare this to depositories. Depositories are priced by SEBI’s tariff schedule — a regulator can revise fees downward at any time, as happened with KYC charges in April 2026. RTAs negotiate fees with AMCs in B2B contracts. The downward pressure on yields is commercially driven, not regulatory. That is a categorically different risk.
THE STRUCTURAL ADVANTAGE IN ONE SENTENCE
A depository’s pricing is set by its regulator. An RTA’s pricing is set by its clients — AMCs who cannot easily replace them. One of those structures is more investable at high valuation multiples. The one with commercial pricing.
The SIP engine: why RTA revenues are structurally stickier than they look
Both CAMS and KFin earn fees as a basis-point percentage of assets under administration — the MF AUM they service. The more AUM they manage, the more they earn. This makes their revenue fundamentally linked to MF AUM growth, which as Post 1 established, is a 19% CAGR structural story. But the stickiness deserves its own analysis.
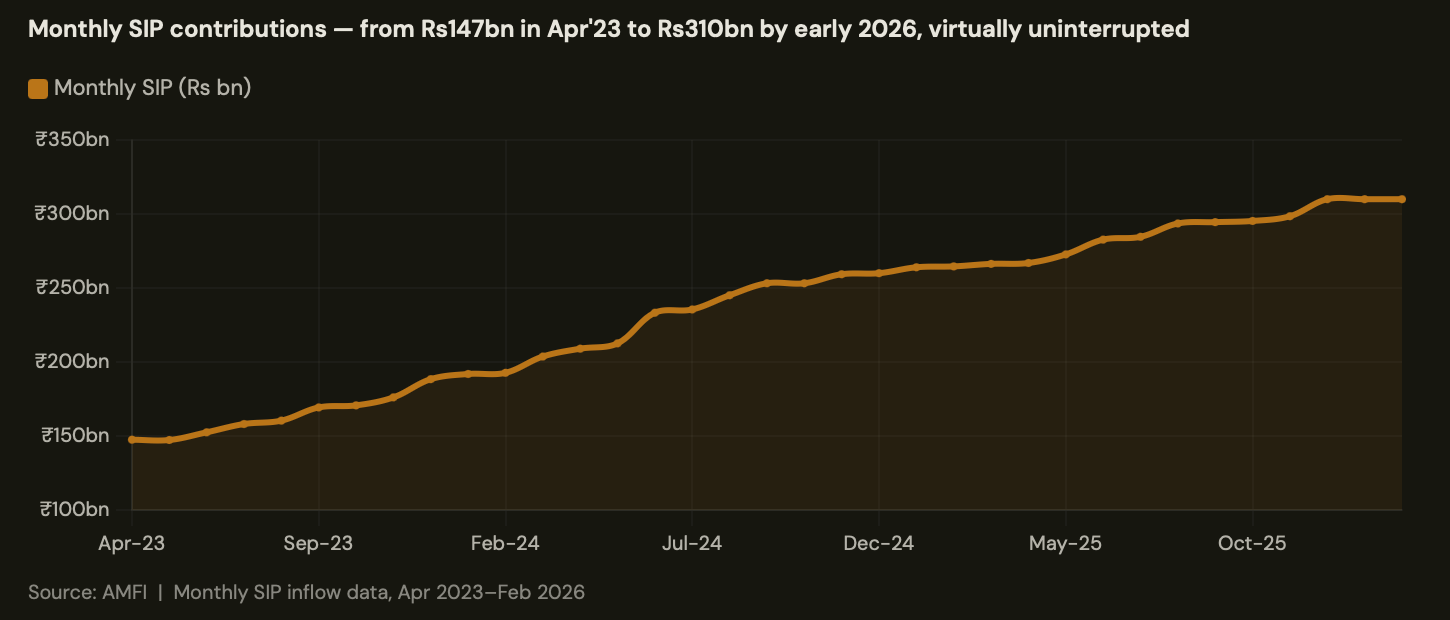
That chart is the most important single exhibit for understanding RTA revenue quality. Monthly SIP contributions have grown from Rs 147 bn in April 2023 to Rs 310 bn in early 2026 — with almost no dip, through multiple market corrections, through rate uncertainty, through the FY25 equity market pullback. The SIP base held.
I think about this through the framework I use for consumer credit. When a borrower commits to an EMI, the psychological contract shifts — it moves from “how much can I invest?” to “I have an obligation I’ve already mentally deducted.” Default and cancellation rates on committed EMIs are structurally lower than on discretionary spending. SIP investors have made the same psychological commitment. The auto-debit runs. The folio grows. The RTA earns.
This is why RTA revenues are more defensive than exchange or brokerage revenues, which are highly correlated with market activity and sentiment. It also explains why research consistently finds better earnings visibility in RTAs than in depositories — whose transaction revenues can compress sharply in a low-volume year.
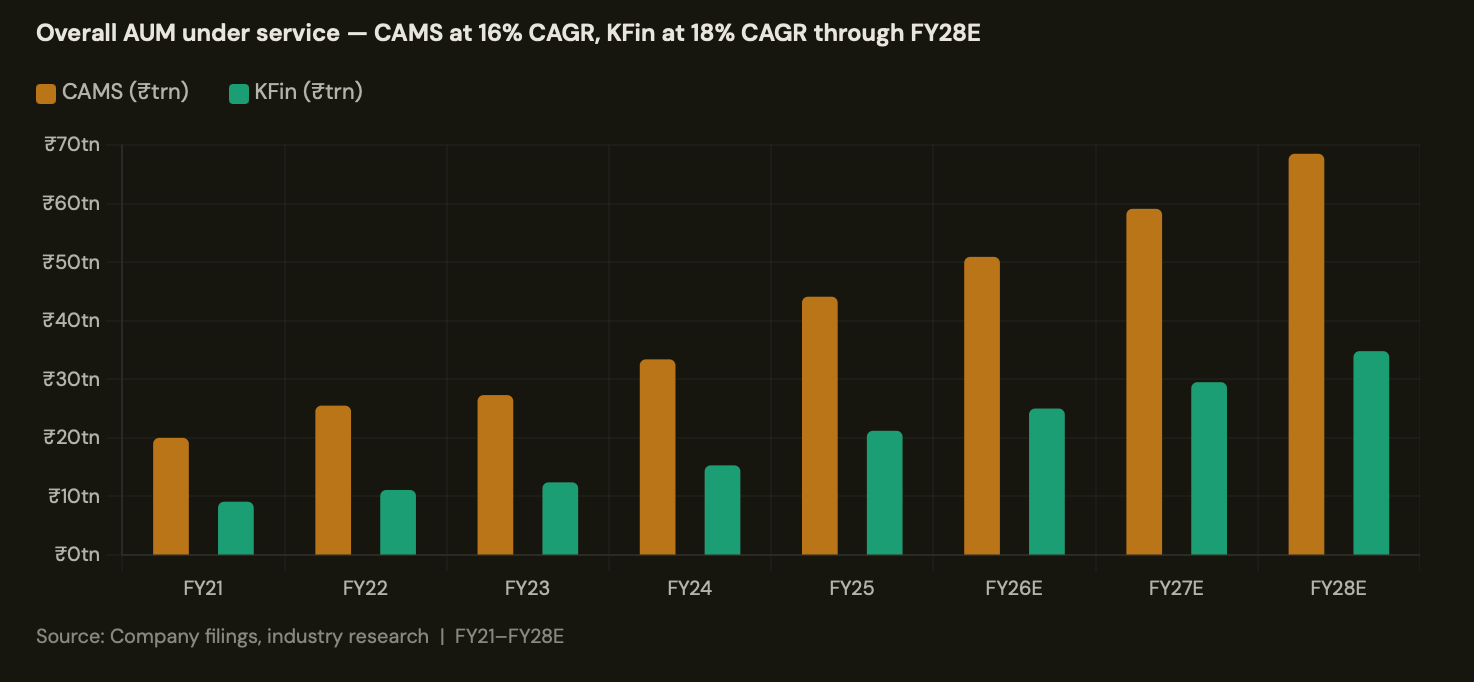
KFin’s faster AUM growth rate (18% vs 16%) is not an accident — it reflects a deliberate client-mix strategy. KFin has tilted toward small and mid-sized AMCs, which are growing faster than the large incumbents. CAMS is concentrated in the top-tier AMC universe.
The client concentration difference: the risk inside CAMS’s dominant position
CAMS manages approximately Rs54-56 trillion of MF AUM — 67% market share. KFin manages approximately Rs25 trillion — 33% share. On the surface, this looks like CAMS is structurally stronger. The concentration data tells a more nuanced story.
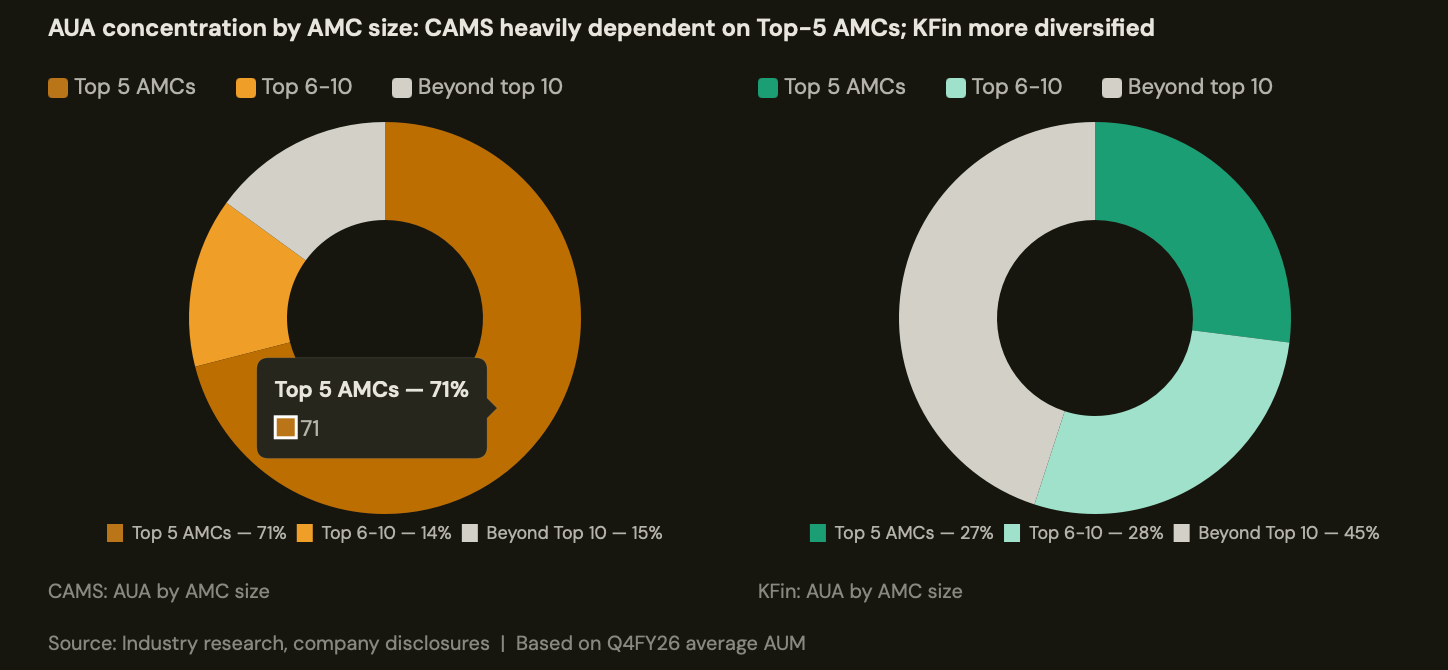
71% of CAMS’s AUA comes from the top-5 AMCs by size. The equivalent figure for KFin is 27%. KFin’s book is spread across mid- and small-AMCs, with 45% of its AUA coming from AMCs ranked 11th or below by size.
This has two implications.
First, KFin’s client base is growing faster — smaller AMCs are gaining market share within the MF industry as SIP flows democratise beyond the top-3 fund houses. KFin rides that tailwind directly.
Second, CAMS is more exposed to a structural scenario where the top-5 AMCs — which dominate its book — face yield pressure or market share losses. Large AMCs have more negotiating power with RTAs on fee renegotiation. Smaller AMCs have less. KFin’s diversified book gives it a structural pricing advantage that market share numbers alone don’t reveal.
The yield compression story: where both businesses lose ground — and how much
One of the structural headwinds for RTAs is yield compression. As MF AUM grows, AMCs renegotiate RTA fees downward — this is commercial pricing at work. Both CAMS and KFin have seen their blended MF fee yields compress over FY22–FY25. The rate of compression, and where they stabilise, matters for the earnings trajectory.
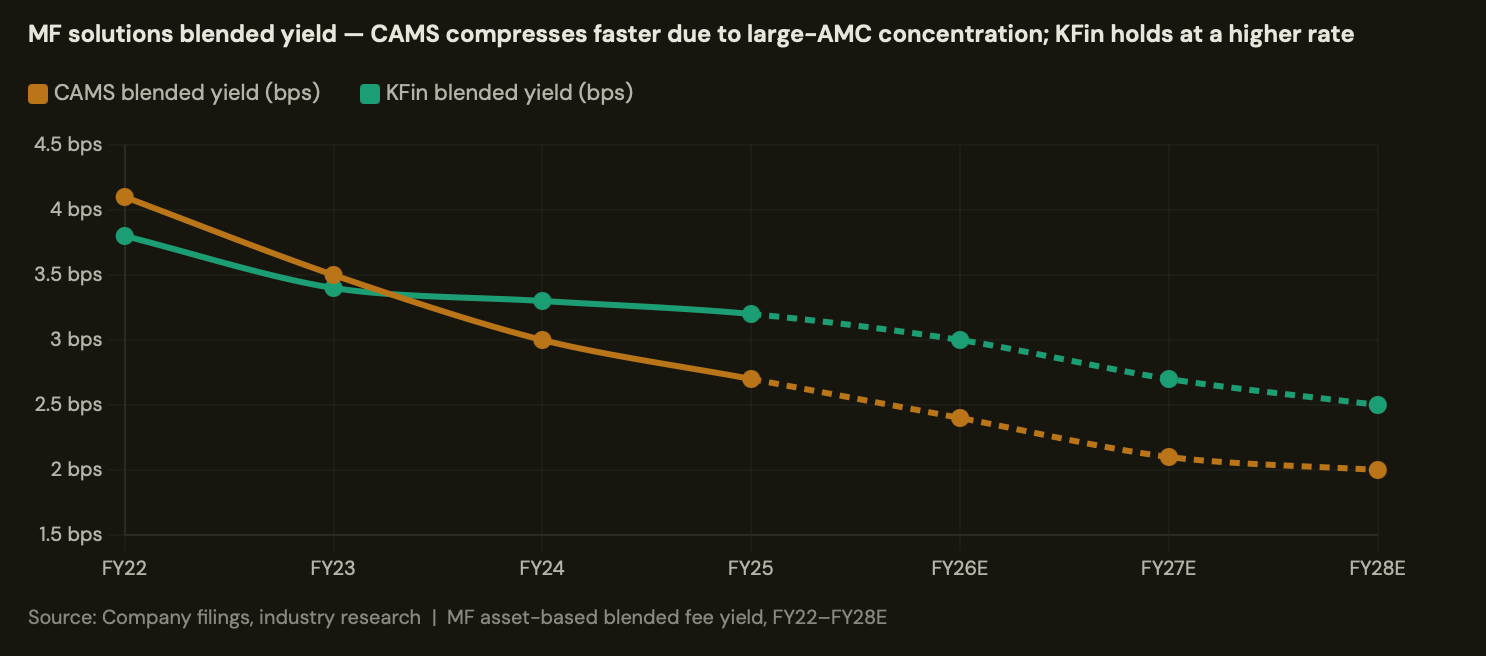
CAMS’s blended yield compressed from 4.1 bps in FY22 to 2.7 bps in FY25 — a 34% compression in three years. KFin compressed from approximately 3.8 bps to 3.2 bps over the same period — a 16% fall. KFin’s higher starting yield, and slower compression rate, reflects its smaller-AMC client mix where it has better pricing leverage.
Research projects both yields declining further but at a more moderate pace. CAMS is expected to stabilise around 2.1 bps by FY28E; KFin around 2.5 bps. The gap persists. This is not a trivial difference — at Rs68.5 trn of projected CAMS AUM by FY28E, 0.4 bps of additional yield implies Rs2.7 billion of annual revenue. The yield differential between the two businesses compounds over time.
“Yield compression is the story everyone uses to argue against RTAs. But the story inside that story — who is compressing faster and why — is where the real differentiation lives. KFin’s diversified AMC book is a structural brake on compression. The market hasn’t priced this adequately.”
The MF revenue picture: same driver, different slope
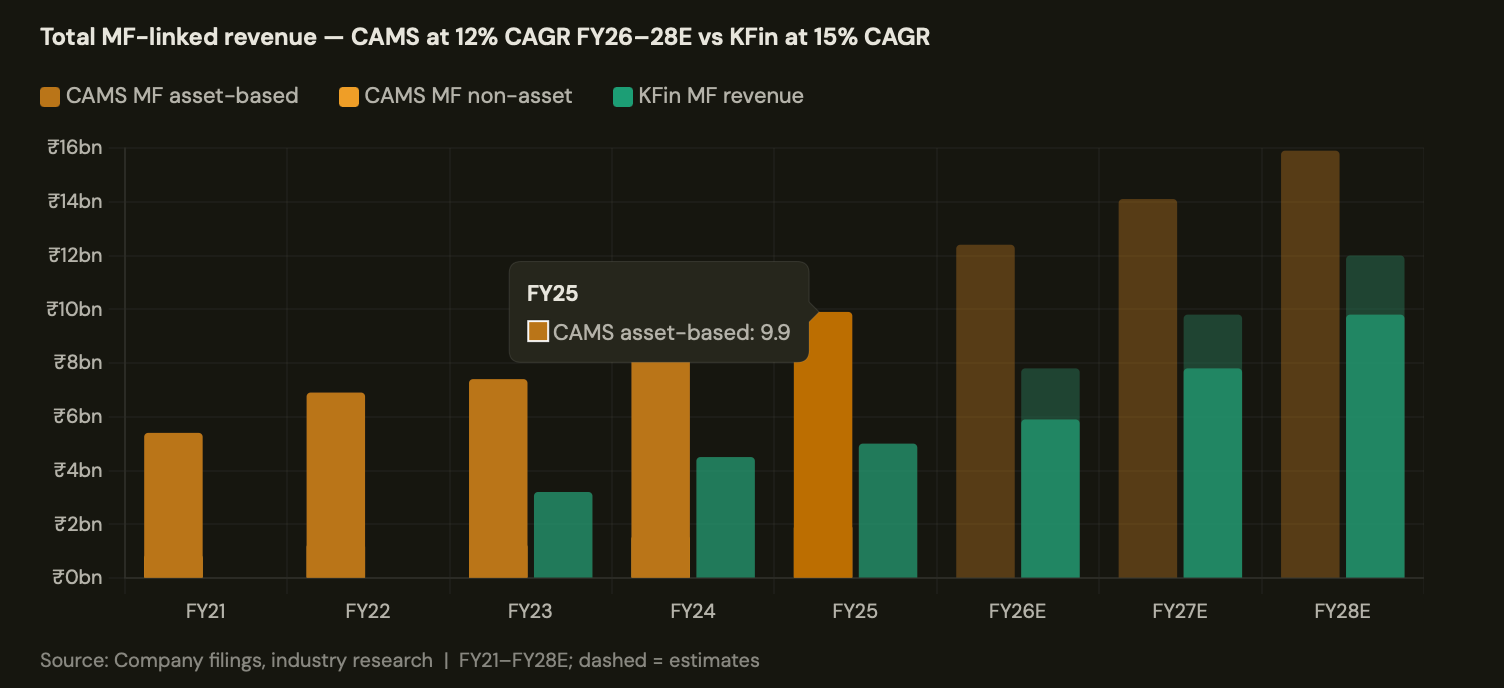
CAMS’s MF revenues grow at 12% CAGR through FY28E — solid, predictable, anchored to AUM growth minus yield compression. KFin’s MF revenues grow at 15% CAGR — same driver, better slope because the AUM base is growing faster and yield holds higher for longer. The divergence is modest in the near term but compounds meaningfully at the PAT level because of operating leverage.
Where the real differentiation lives: non-MF revenue optionalities
If MF revenues were the whole story, CAMS would be the obvious hold — it’s the larger, more stable franchise. The investment case becomes more interesting when you look at non-MF revenues. Both CAMS and KFin have spent the last four years building businesses adjacent to their core MF processing infrastructure. These adjacent businesses are growing at roughly 21-22% CAGR — nearly double the MF revenue rate. And they are structurally different between the two companies.
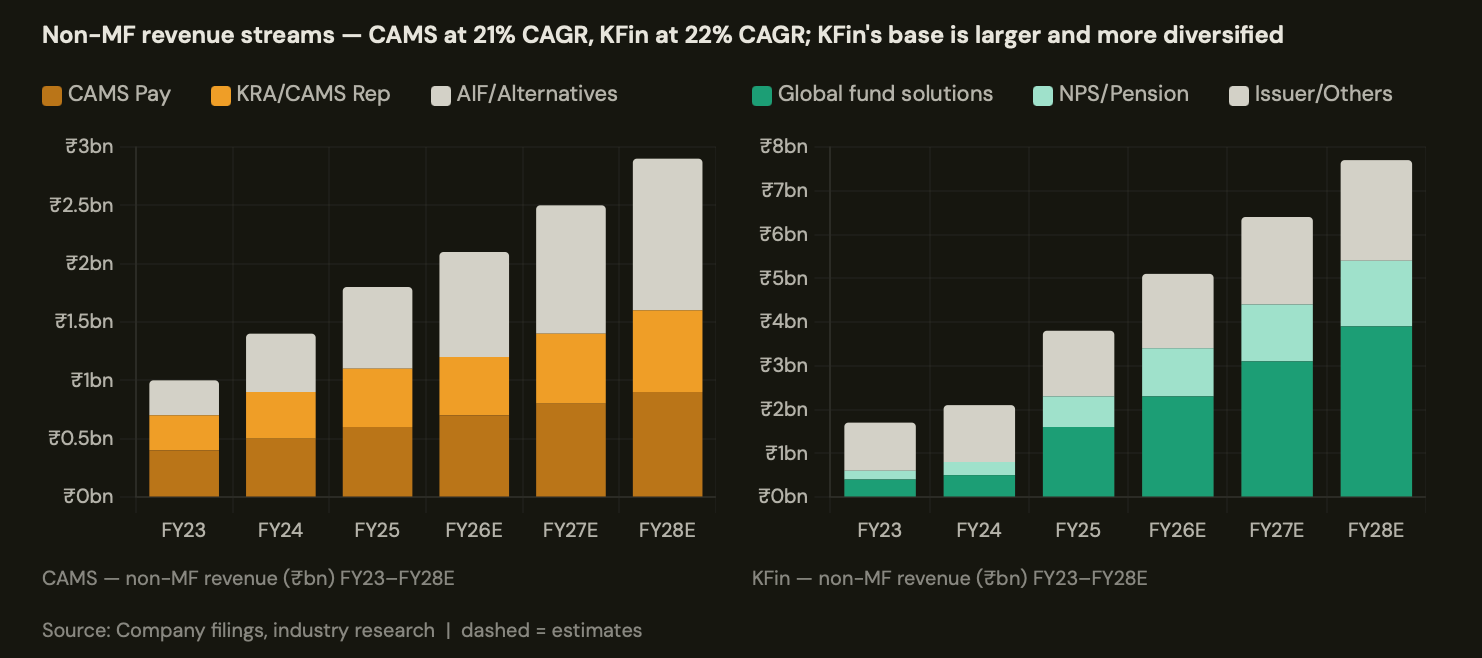
CAMS’s non-MF growth is primarily domestic: CAMS Pay (payment solutions for AMCs and financial institutions), KRA (the KYC Registration Agency business which, like CDSL’s CVL, faces the April 2026 SEBI fee revision), CAMS Rep (distributor management), and a nascent AIF/alternatives platform. These are real businesses — CAMS Pay in particular is gaining traction as AMCs consolidate payment infrastructure. But they are adjacent to the same domestic financial ecosystem that the core MF business lives in.
KFin’s non-MF business has a different character: it includes NPS/pension account servicing (a structurally growing government-mandated financial product), an issuer solutions business that spans IPO registrar services, and — most importantly — a global fund administration business built through two international acquisitions: Ascent Fund Services and Hexagram. This is where the investment thesis for KFin really separates from CAMS.
The Ascent flywheel: the optionality the market hasn’t priced
Between FY22 and FY24, KFin acquired Ascent Fund Services (a Cayman-based fund administrator) and Hexagram (a Southeast Asia-focused fund solutions provider). These acquisitions were not cheap and they were not immediately accretive. Ascent in particular was a loss-making business when acquired — its EBITDA margin was running at approximately -11% in FY23.
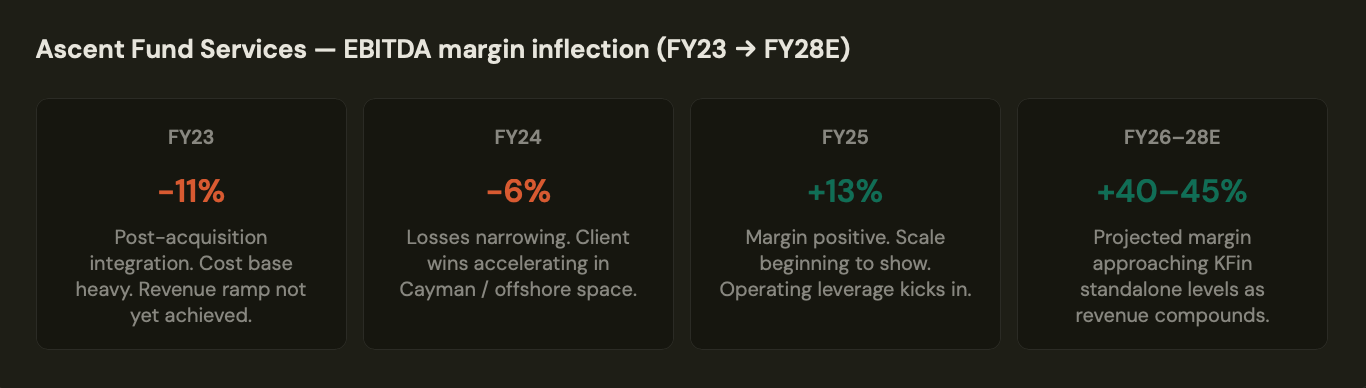
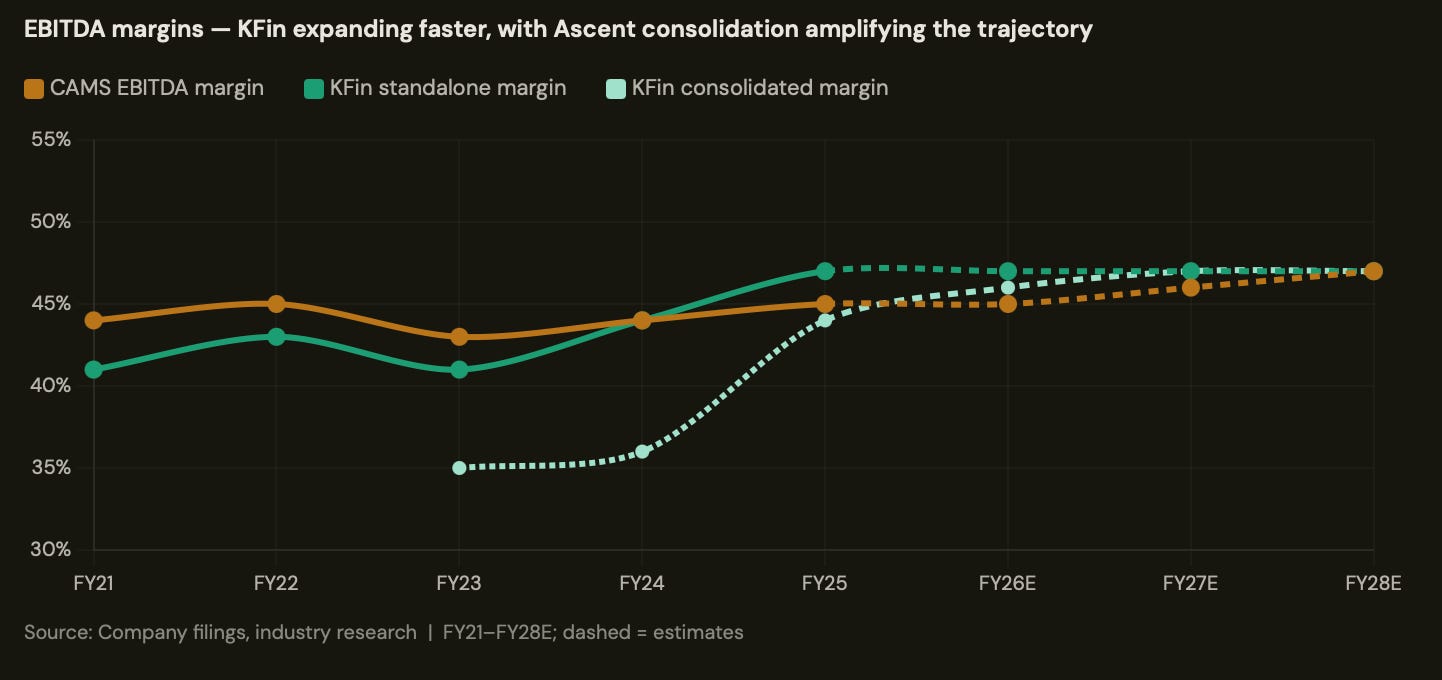
From -11% to +13% EBITDA margin in two years. That is a material inflection — and it happened while most sell-side models were treating Ascent as a distant footnote in KFin’s story. The compound effect is significant: KFin’s consolidated EBITDA margin was already expanding faster than CAMS’s standalone margin even before Ascent turned fully profitable. As Ascent approaches KFin’s standalone margin of ~47%, the consolidated earnings base will re-rate upward.
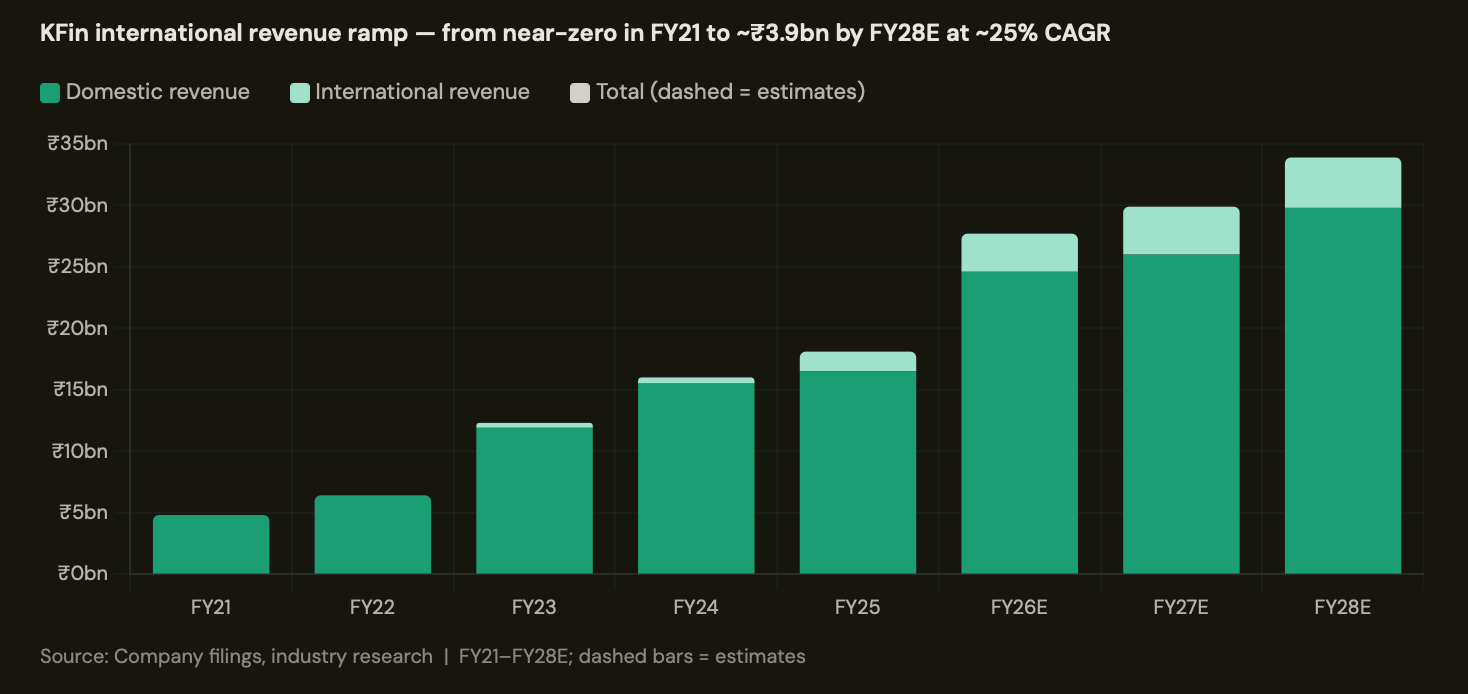
International revenue grows from approximately Rs 0.4 bn in FY23 to a projected Rs 3.9 bn by FY28E — a trajectory that takes it from rounding error to approximately 10% of KFin’s total revenue base. More importantly, because this revenue stream is high-margin (fund administration in offshore jurisdictions commands premium fees), it will contribute disproportionately to PAT growth. The compounding is back-loaded: the heavy lifting of integration and client acquisition has already happened. The returns are now being harvested.
THE SCUTTLEBUTT READ ON INTERNATIONAL FUND ADMINISTRATION
Global fund administration is a consolidating industry. Large players like SS&C, Citco, and Northern Trust administer hundreds of billions in offshore fund assets. KFin via Ascent is building the same capability for the mid-market — Cayman, Singapore, and Southeast Asia-domiciled funds that are too small for the bulge-bracket administrators but large enough to demand professional-grade service. If you’ve spent time near the institutional fund industry (as I have through credit and capital markets work), you understand the switching costs here are even higher than domestic MF. Fund administrators hold the full investor registry, accounting records, and regulatory filings. The data gravity moat in this business is substantial.
EBITDA margins and PAT: the convergence story
The PAT convergence chart is the clearest visual argument for paying attention to KFin at current prices. In FY22, CAMS earned Rs2.9bn PAT versus KFin’s Rs1.5bn. By FY28E, CAMS is projected at Rs6.1bn and KFin at Rs5.6bn. The gap closes from 2x to near-parity in six years — driven by KFin’s 27% PAT CAGR versus CAMS’s 18%.
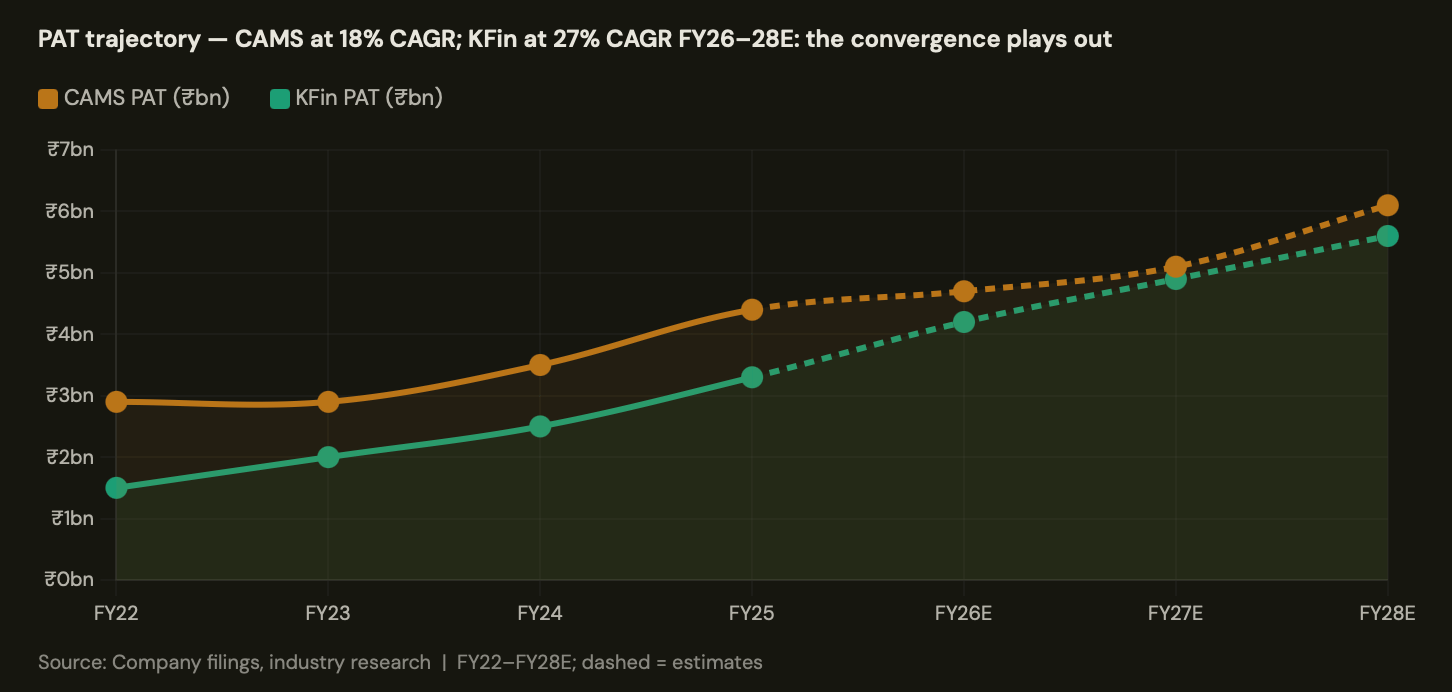
Now overlay the valuation: CAMS trades at approximately 56x FY26E P/E.
KFin trades at approximately 46x. You are paying more for slower PAT growth in CAMS, and less for faster PAT growth in KFin. The international optionality at KFin is not yet in the consensus model — Ascent’s inflection happened in FY25, and most DCF models are built on FY24 data. That lag is the mispricing.
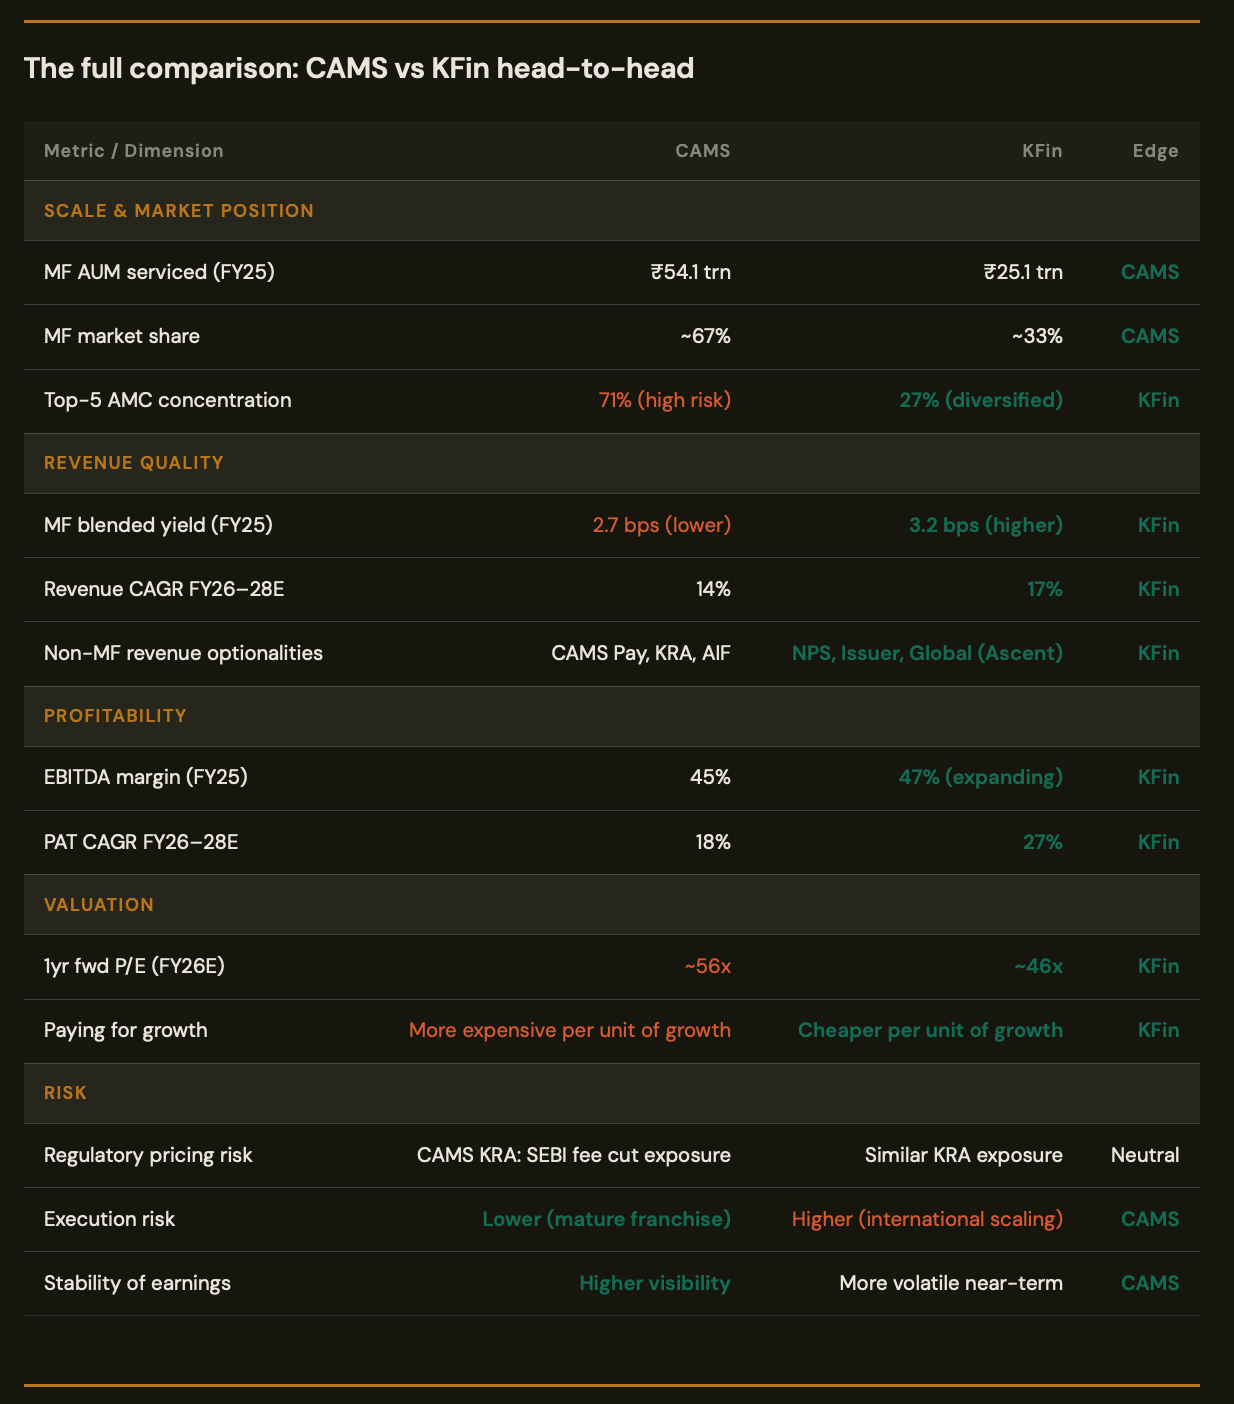
The full comparison: CAMS vs KFin head-to-head
The overall revenue picture: CAMS vs KFin normalised for growth
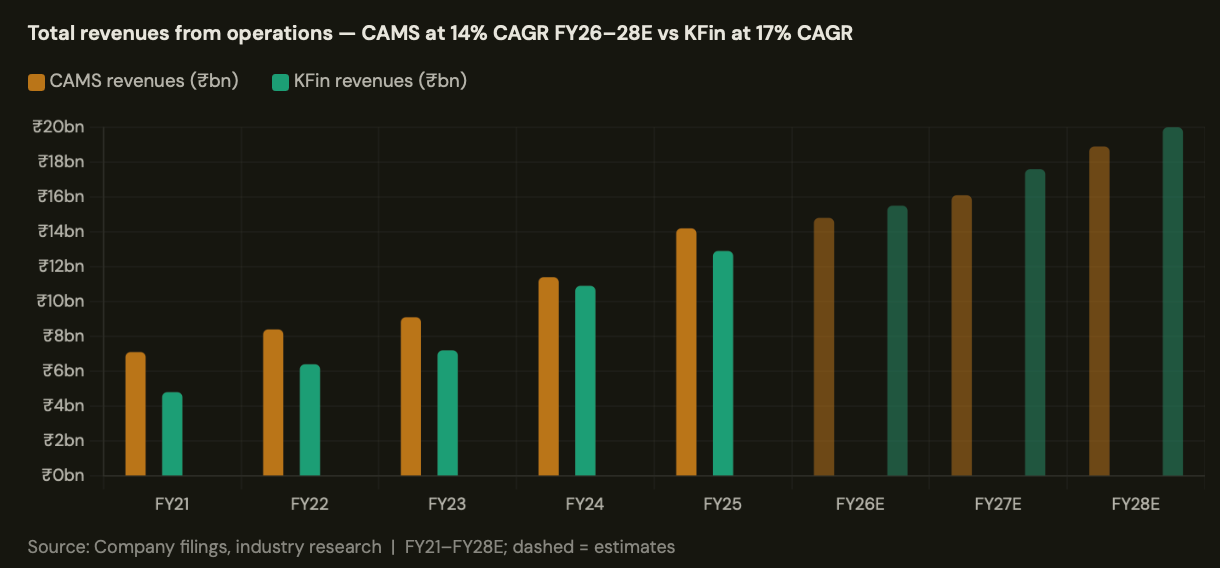
KFin’s revenue crosses Rs 20 bn by FY28E — still below CAMS’s Rs 18.9 bn in absolute terms but growing faster on a proportional basis. The cross-over in PAT terms happens before the revenue cross-over, purely because of Ascent’s margin expansion. A business that is driving 27% PAT CAGR while trading at a 10-point P/E discount to a business with 18% PAT CAGR is, by definition, priced with more room for error.
The mental model: second-level thinking on which business to own
Howard Marks’s second-level thinking framework applies precisely here. The first-level read: “CAMS is the dominant player with 67% market share — it’s the obvious hold.” That’s the consensus, and it’s already priced at 56x FY26E P/E.
The second-level read: “The dominant player is concentrated in the largest AMCs, where fee pressure is highest. Its non-MF optionalities are entirely domestic. Its PAT growth is capped at 18% because the yield compression headwind is structural.
Meanwhile, the challenger has diversified its AMC book, is growing international revenues from a business that just turned profitable after two years of losses, and trades 10 P/E points cheaper. The market is paying for CAMS’s known story. KFin’s emerging story isn’t in the price yet.”
That is not an argument to ignore CAMS. It’s an argument that at current relative valuations — 56x vs 46x — the risk-reward asymmetry favours KFin more than the consensus “prefer CAMS” view suggests.
My read before the verdict
Post 4 will give you the full valuation comparison with global peers and the final verdict. But let me leave Post 3 with the framing that I think is analytically honest:
Own both, weight toward KFin. CAMS is the right core holding for an investor who wants maximum earnings visibility with the most defensible franchise. It is the NSDL of the RTA world — dominant, stable, slightly more expensive. KFin is the CDSL equivalent in the RTA world, except it has an international growth lever that CDSL doesn’t. KFin at 46x FY26E P/E, with a 27% PAT CAGR and Ascent margins inflecting, is the more interesting entry point right now.
The structural story — India at 13.4% demat penetration, MF AUM at 20% of GDP, SIP compounding at 21% annually — benefits both companies equally. The differentiation is in the slope of compounding, the pricing leverage, and the optionality. On all three, KFin edges CAMS at current relative valuations. That is not a permanent truth — it is a current-price truth. Watch the relative P/E. If KFin re-rates to CAMS levels, the argument inverts.
Post 4 closes out this series: the global peer valuation table, the full ranking of all four companies on risk-reward, and the one question every Indian investor should ask before buying any of these at current prices. Would be out soon !