Mapped the infrastructure, dissected the depositories, compared the RTAs. Now the hard part: what do you actually do with these four companies ?
Three posts. Twelve charts each. One full series on businesses that most Indian investors have held without ever properly understanding. Now it’s time to put the valuation table on the page, hold all four names up to the light of global peers, and say plainly what each is worth at current prices — and more importantly, what each is worth relative to the risk you’re taking to own it.
Let me start with the context that makes the valuation conversation honest. Indian capital market infrastructure stocks have been on a remarkable run.
CDSL delivered 38% EPS CAGR over FY20–25. KFin and CAMS re-rated sharply as the MF SIP story went mainstream. The stocks corrected in FY25 and early FY26 alongside broader market weakness. Industry research now calls valuations “attractive, especially for RTAs.” That language needs stress-testing before you accept it.
The global peer table — where India’s infrastructure stocks sit internationally
The most grounding exercise you can do when evaluating Indian market infrastructure stocks is to compare them to their global equivalents — the CME Groups, ICEs, and HKEXs of the world.
The comparison is imperfect but instructive.
Global exchanges and infrastructure operators are mature, high-margin, regulated monopolies in developed markets. India’s equivalents are earlier-stage, faster-growing, in a less penetrated market. The premium Indian stocks command over global peers is the growth premium. The question is whether that premium is justified by the growth trajectory — and whether the regulatory structure is comparable.
Global capital market infrastructure peer comparison
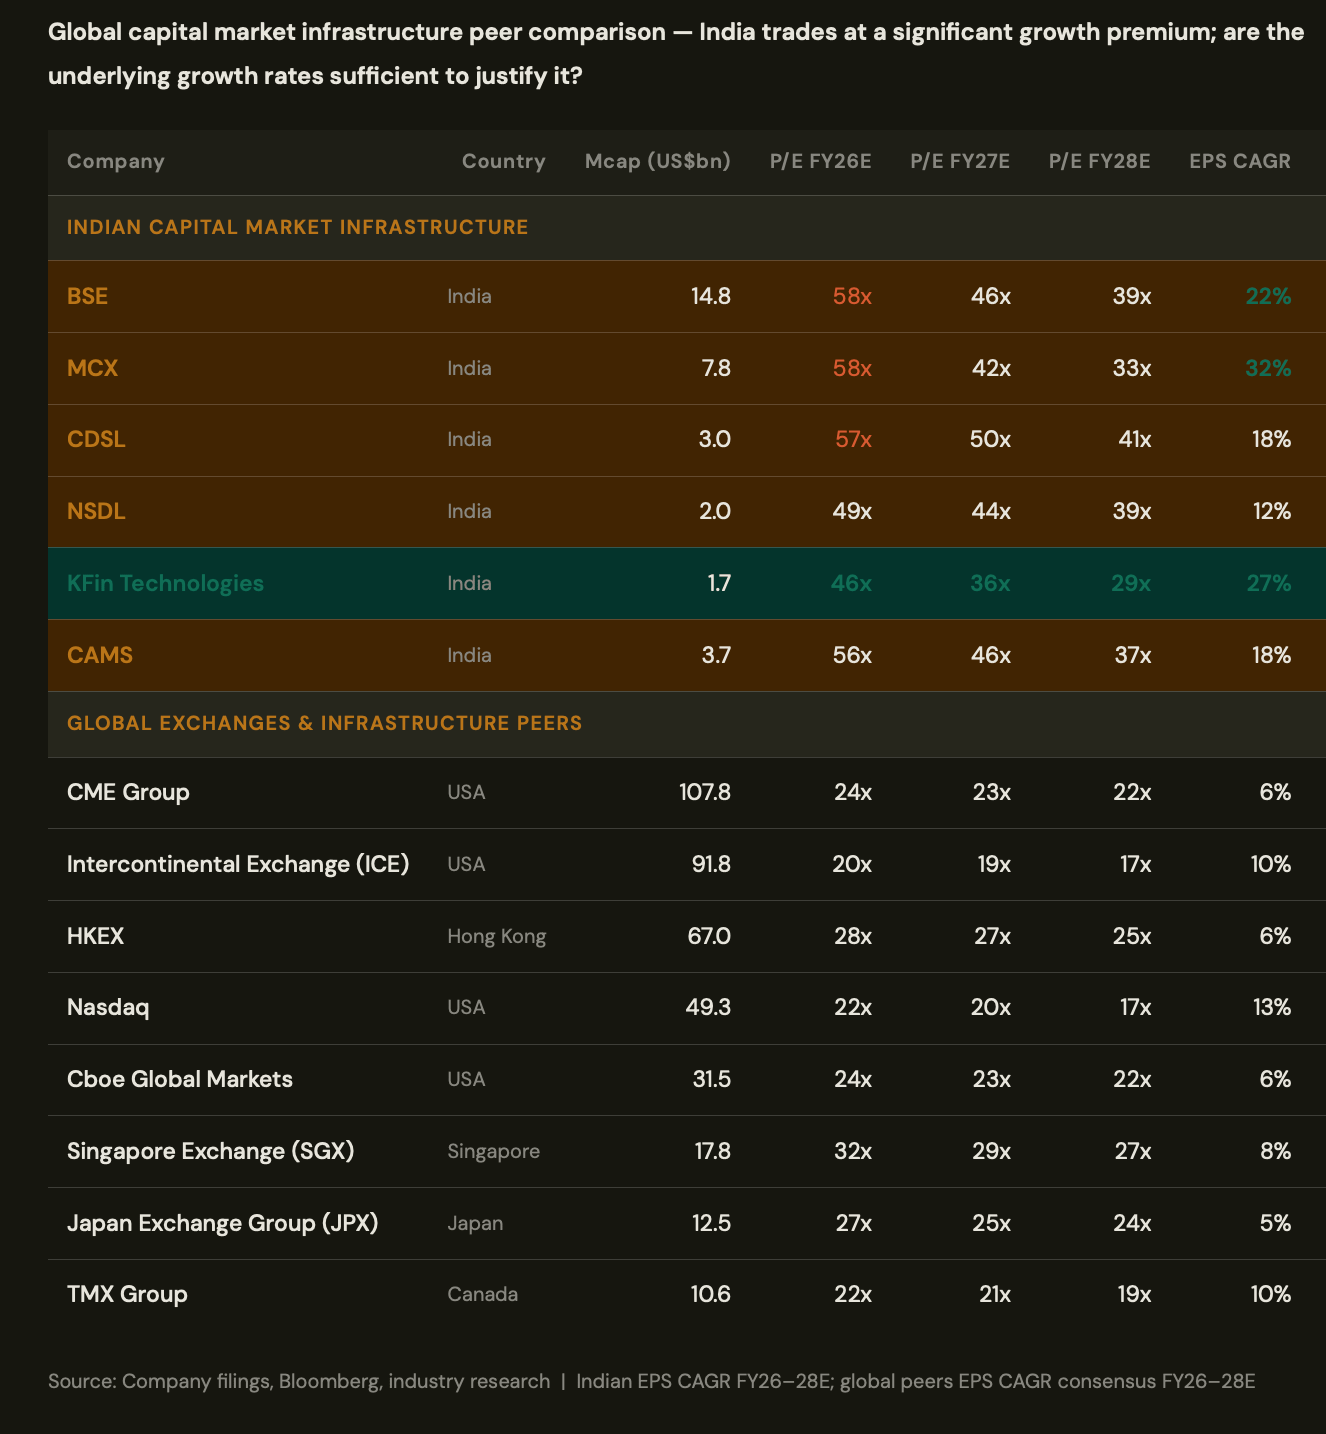
The table makes the growth-premium argument visible and testable. Global infrastructure peers trade at 20–32x P/E with 5–13% EPS CAGR. India’s equivalents trade at 46–57x P/E with 12–27% EPS CAGR. The implied PEG ratios are not wildly different — but they are not obviously cheap either. The premium rests entirely on the assumption that India’s growth trajectory sustains. If it does — and the structural case in Posts 1 through 3 says it should — the current valuations are defensible. If growth disappoints, or if the regulatory environment turns more restrictive, the reversion to global peer multiples is painful from current prices.
One number from this table deserves separate attention: KFin at 29x FY28E P/E with 27% EPS CAGR. That is the cheapest growth in the table on a forward basis — and the only Indian infrastructure stock that is approaching global peer multiples on FY28E earnings. The market is discounting KFin for the Ascent integration noise and potential promoter stake monetisation overhang. If those headwinds are transitory — and the Ascent margin data in Post 3 suggests they are — then KFin at FY28E multiples is the most compelling entry point in this cluster.
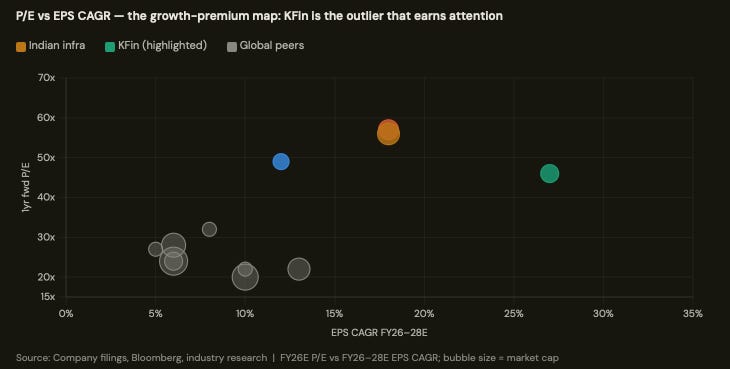
That scatter plot is where the verdict lives in one visual. Global peers cluster in the bottom-left: modest growth, modest multiples. Indian infrastructure sits in the upper-right: high multiples, high growth. KFin is the exception — it carries the highest EPS CAGR in the entire peer set but trades at the lowest P/E among Indian names. That asymmetry is the investment case.
The P/E vs Historical Mean — the honest valuation check
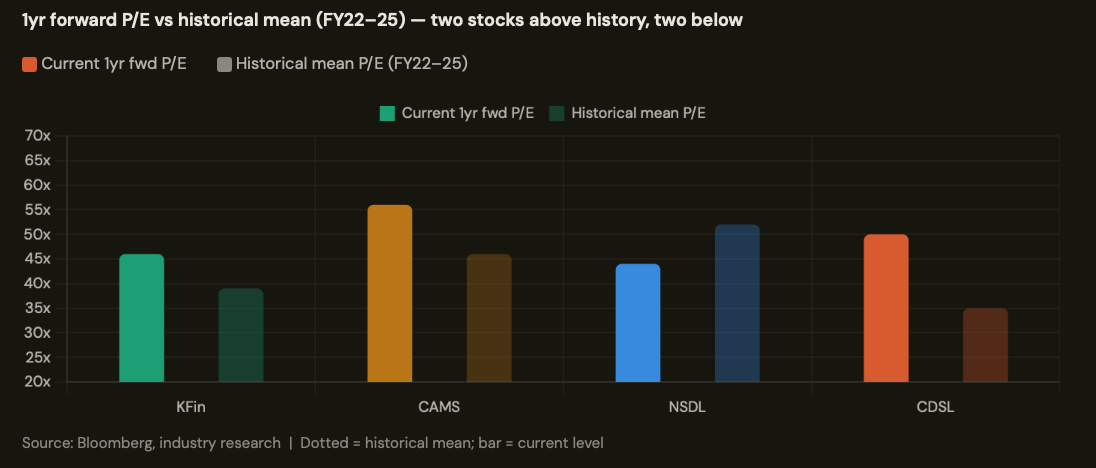
The historical mean comparison is the most useful single check before buying any of these names. The RTA historical mean P/E over FY22–25 was approximately 39x.
Post the FY25 correction, KFin trades at 46x FY26E (below its own implied re-rating from growth) and CAMS at 56x (above the historical mean but justified by earnings quality). For depositories, the mean was approximately 47x: CDSL sits above at 50x while NSDL sits below at 44x — the contrarian entry among the four.
The regulatory risk matrix — not all P/E multiples carry the same embedded risk
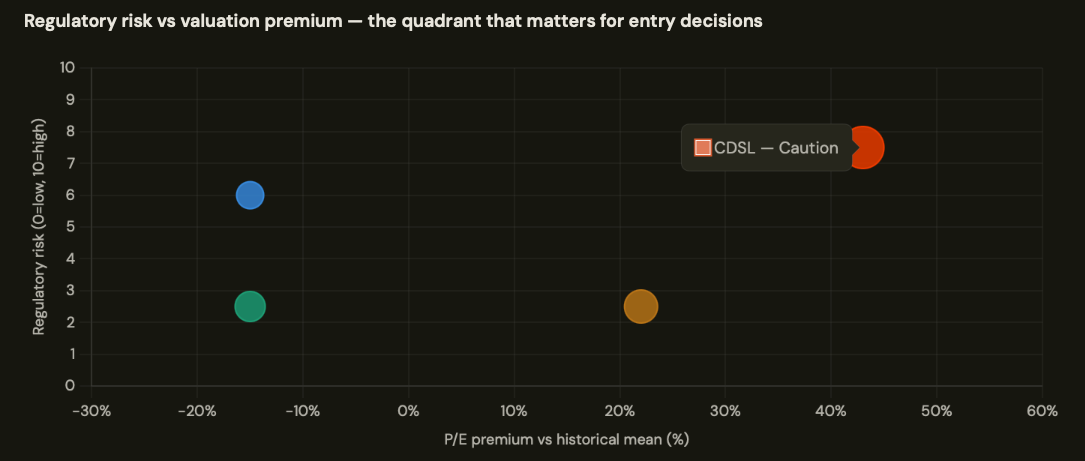
Orange - CAMS =Acceptable; Green-KFIN = Ideal; Blue- NSDL= Value
The quadrant chart makes the risk-adjusted ranking explicit. Low regulatory risk with below-mean valuation is the ideal quadrant — that’s where KFin sits. High regulatory risk with above-mean valuation is the danger zone — that’s the honest description of CDSL right now. CAMS earns its above-mean valuation through earnings quality and stability. NSDL’s regulatory risk is real (SEBI pricing exposure) but its below-mean valuation provides cushion.
EPS trajectory — what the market is pricing across the cycle
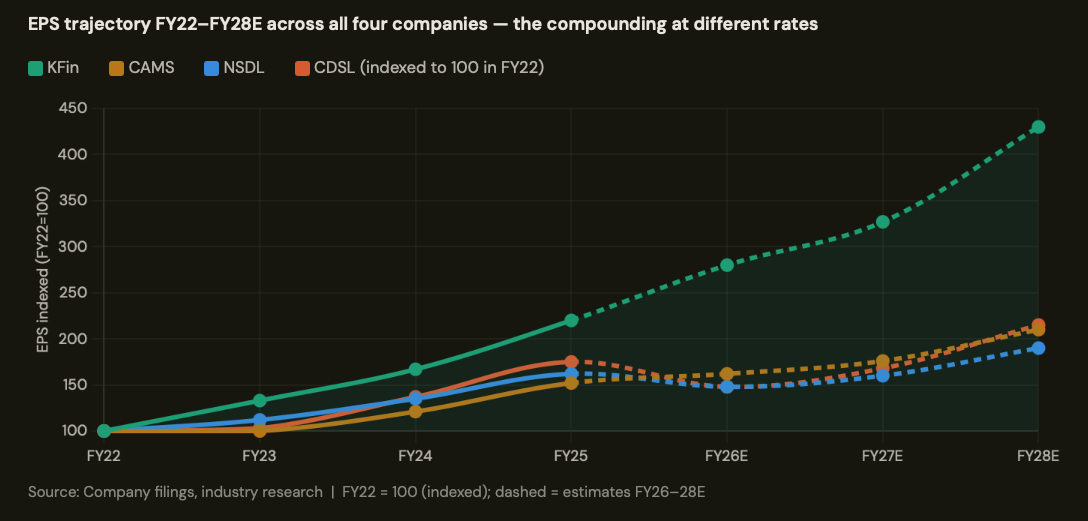
Indexed to 100 in FY22, by FY28E: KFin reaches approximately 430 (4.3x compounding in 6 years), CAMS reaches approximately 280, CDSL approximately 260, and NSDL approximately 200. The KFin line is driven by the international business reaching scale. The question every investor must ask is: at what price has that compounding already been recognised by the market? The answer, as Exhibits 2 and 3 show, is that it hasn’t been — yet.
The four verdict cards
KFin Technologies : Best risk-adjusted entry in the cluster. Cheapest growth in the table. Ascent margin inflection not fully priced. AMC mix skewed toward faster-growing mid-sized funds. The one headwind — promoter stake overhang — is a timing risk, not a structural one. At 46x with 27% PAT CAGR and international optionality, this is the most asymmetric name. The near-term noise around Ascent integration is the entry window, not the reason to wait.
CAMS
The right core holding for an investor who prioritises earnings predictability over growth rate. 67% MF AUM share doesn’t erode overnight. CAMS Pay optionality is real but modest. The honest caveat: at 56x with 18% PAT CAGR, you’re paying for the franchise quality premium in full. The holding thesis is the domestic SIP compounding story, not a re-rating catalyst. Own it for what it is — a high-quality, lower-upside compounder.
NSDL
The contrarian name in the cluster — trading below its own historical mean despite holding 86% of India’s demat value. The MCA small-company threshold revision is a real headwind on joining fees. But the core institutional custody franchise doesn’t move. FIIs, domestic institutions, and large AMCs are locked into NSDL’s rails. At 44x with 12% PAT CAGR, the upside is modest but the downside is cushioned by the valuation discount to history.
CDSL
The structural thesis is intact — India’s largest retail depository, 82% account share, SIP tailwind. But the entry price matters. At 50x FY26E with an active SEBI KYC fee cut compressing CVL revenues through FY27, there is almost no margin of safety. The correct holding posture: watch for a correction to ~35–38x 1yr fwd P/E. That requires either a market dislocation or continued earnings disappointment.
The one question every investor should ask before buying any of these
THE SINGLE MOST IMPORTANT QUESTION
“Am I paying for the structural story, or am I paying for the cycle that just happened?”
The structural story — India moving from 6% to 15–20% household equity exposure, demat penetration from 13% to 30%+, SIP compounding at 20%+ annually — is real and multi-decade. It will unfold regardless of what the Nifty does in any given year. These four companies will participate in that story whether you buy them today or eighteen months from now.
But the CAGR numbers most investors quote — CDSL’s 38% EPS CAGR over FY20–25, CAMS’s 22% revenue CAGR — were not generated by the structural story alone. They were generated by the structural story plus an extraordinary confluence of favourable conditions: peak discount broker onboarding, an IPO supercycle, a post-COVID equity market rally, SEBI liberalisation, and near-zero interest rates globally. That combination will not repeat at the same intensity over FY26–28E.
Research projects 15–22% EPS CAGR for FY26–28E — a significant deceleration from the FY20–25 pace. At 44–57x P/E, you are paying cycle-peak multiples for normalised-growth earnings. The structural story justifies owning these businesses. The cycle normalisation requires being honest about entry price. If you’re buying at 50x for 15% EPS CAGR because “India’s capital markets are in an early innings” — you may be right about the innings and wrong about the price. Those two things can both be true simultaneously.
THE INVISIBLE ENGINES — SERIES COMPLETE
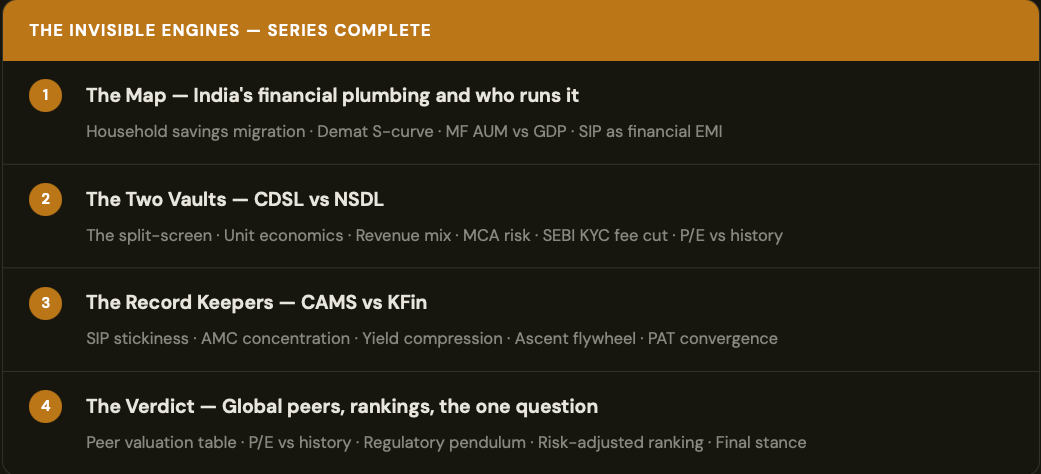
This series was built from first principles using publicly available data, company filings, SEBI disclosures, and industry research. None of this is investment advice. Everything here is a framework for thinking — apply your own judgment, risk tolerance, and investment horizon before acting.
Thanks for reading till here. If you found this series useful, you might enjoy some of my other posts exploring markets, personal finance, and investor behavior.
Other Posts of this series:
Post 1 : The Map: Understanding India’s Financial Plumbing
Post 2 : The Two Vaults: CDSL vs NSDL
Post 3 : The Record Keepers: Why RTAs Are the Better Business Right Now
Post 4 : You have just read !