Every time a demat account is opened in India, a company you probably don’t think about earns a fee. Every SIP you’ve ever run, every IPO allotment you’ve received, every corporate action on a stock you hold — they all pass through the same four chokepoints. CDSL, NSDL, CAMS, KFin.
Invisible engines. Visible earnings.
I want to start this series not with a stock recommendation, but with a map. Because before you can understand why these businesses are worth the attention, you need to understand what they actually do — and why India’s specific stage of financial development creates a structural tailwind that has nothing to do with quarterly earnings or market direction.
Axis Capital just initiated coverage on this cluster — depositories and RTAs — with a 150-page deep-dive titled “Invisible Engines, Visible Earnings.” Over four posts, I’m going to pull out the data that matters, add what the report politely skirts around, and give you a framework for thinking about these businesses that goes beyond standard sell-side analysis.
Today: the macro canvas. The story of why India is at a once-in-a-generation inflection point for financial asset adoption — and why these four companies are the only way to own the structural shift, not just the direction of equity markets.
What these four companies actually do
Whai I learnt/understood is that these are not brokers. They don’t take positions. They don’t own assets. They are infrastructure operators — closer to a toll road operator or a payment switch than to any financial institution you’re used to thinking about.
The value chain for any Indian securities transaction has five layers (see the diagram ):
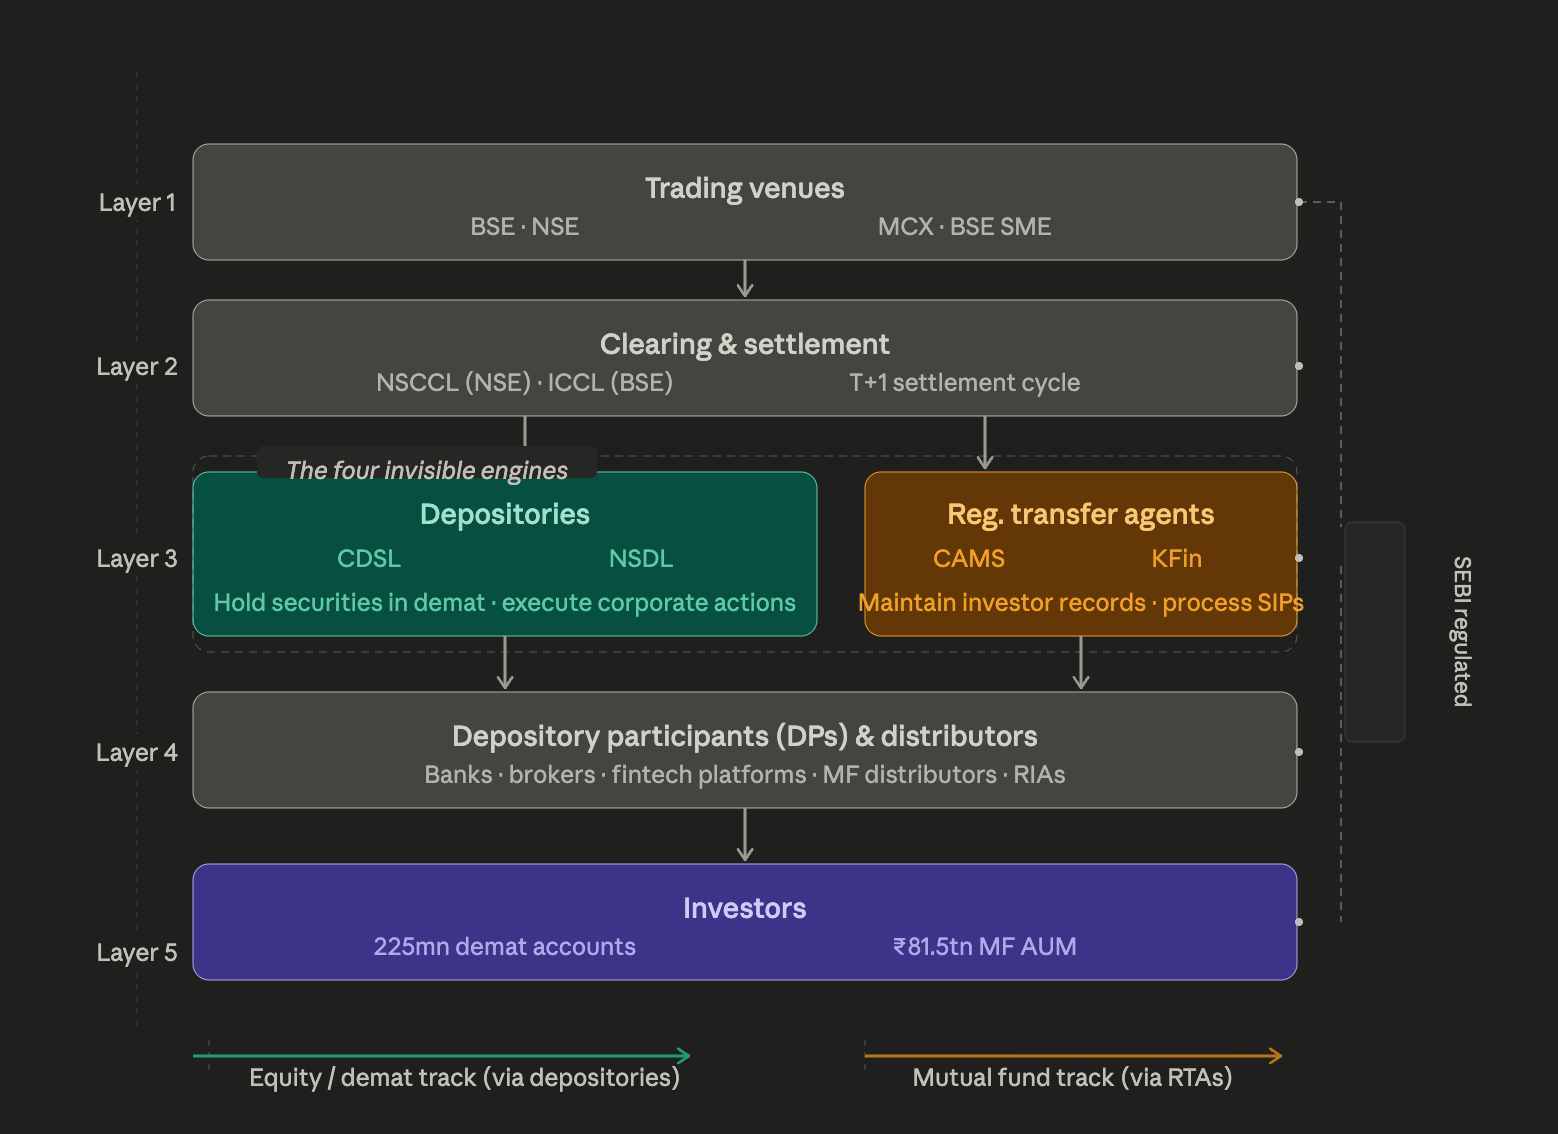
Trading venues (NSE, BSE) where buyers and sellers are matched.
Clearing corporations (NSCCL, ICCL) that ensure trade obligations are honoured. Depositories (CDSL, NSDL) that hold your securities in electronic form and execute transfers — they are the ledger.
RTAs (CAMS, KFin) that are the registrar and transfer agents for mutual funds — they record every unit you hold, process every SIP, handle every redemption. And at the end: investors.
The highlighted nodes in the diagram above — CDSL, NSDL, CAMS, KFin — are the subject of this series. The reason I focus on them and not the exchanges: they are structurally more insulated from market volatility. Exchanges earn from trading volume, which is cyclical. Depositories and RTAs earn from custody and AUM — which are structurally sticky and grow with the size of the market, not just its direction.
Institutional Candour Point
We can describe CDSL and NSDL's position as "high barriers to entry." That is polite understatement. These are legally mandated duopolies. SEBI regulates the number of depositories. You cannot start a third one. CAMS and KFin together process over 98% of Indian MF AUM. Between the four of them, they process every unit of financial activity in the regulated Indian capital market. That is not a competitive moat — it is a structural impossibility of substitution.
The shift that changes everything: India’s household savings are migrating
Every thesis about these four companies ultimately rests on one macro bet: that Indian households will continue to move savings from physical assets (gold, real estate) and bank deposits into financial assets (equities, mutual funds). The data says this is already happening — and it is still in the early stages.
EXHIBIT 1
Flow of household savings toward equities & MFs — and how it compares globally
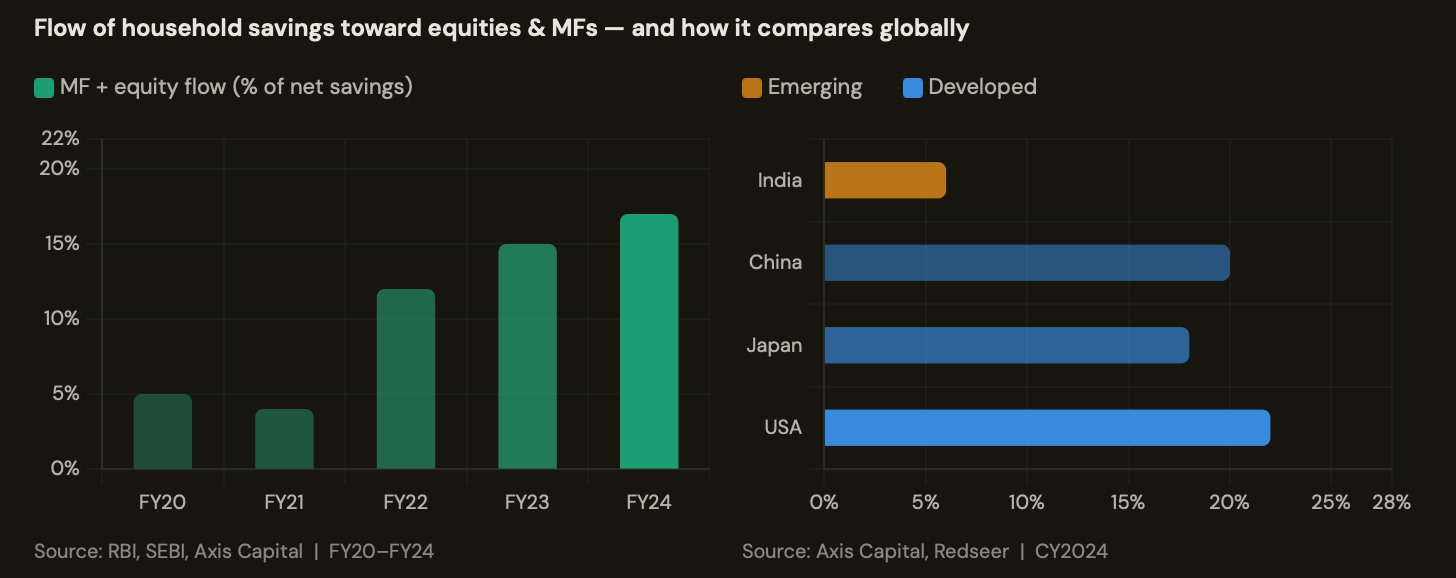
Two data points anchor the entire macro story.
First: the share of net household financial savings flowing into equities and mutual funds jumped from 5% in FY20 to 17% in FY24. This is not a blip — it is a structural reallocation driven by declining real estate returns, rising financial literacy, and the frictionless account-opening experience that discount brokers enabled.
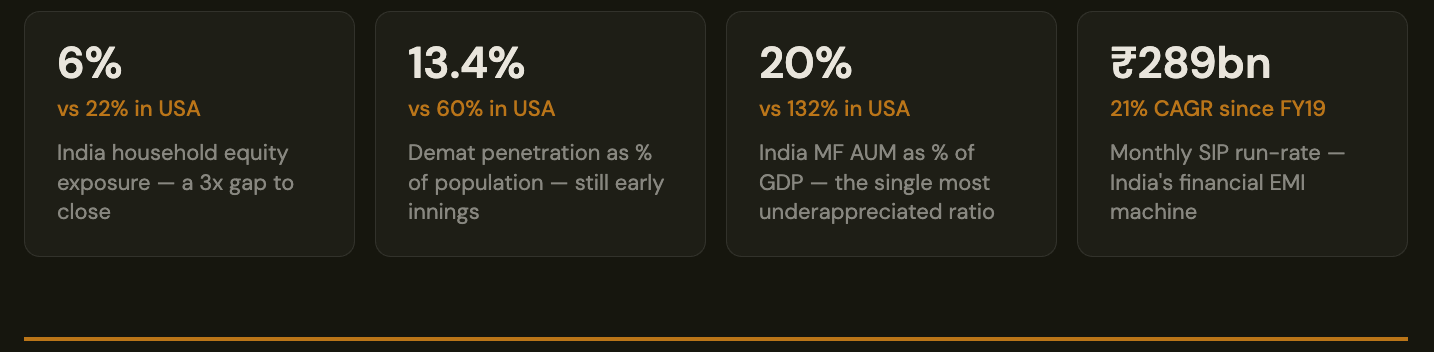
Second: even at 17%, India is moving toward a target that remains 3–4x higher than current levels. US households allocate ~22% of their total assets to equities. India is at 6%. That gap is the entire long-term thesis.
India is at 6%. That gap is the entire long-term thesis.
From a credit analyst’s standpoint, this migration matters beyond the investment angle. A household that moves from gold and real estate to equity and MF holdings is building a more liquid, diversified balance sheet. Historically, concentrated physical asset exposure — especially real estate — is the dominant driver of household financial stress in India. The shift to financial assets is not just an investment story. It is a systemic risk reduction story for the Indian economy.
The S-curve: where demat penetration actually stands
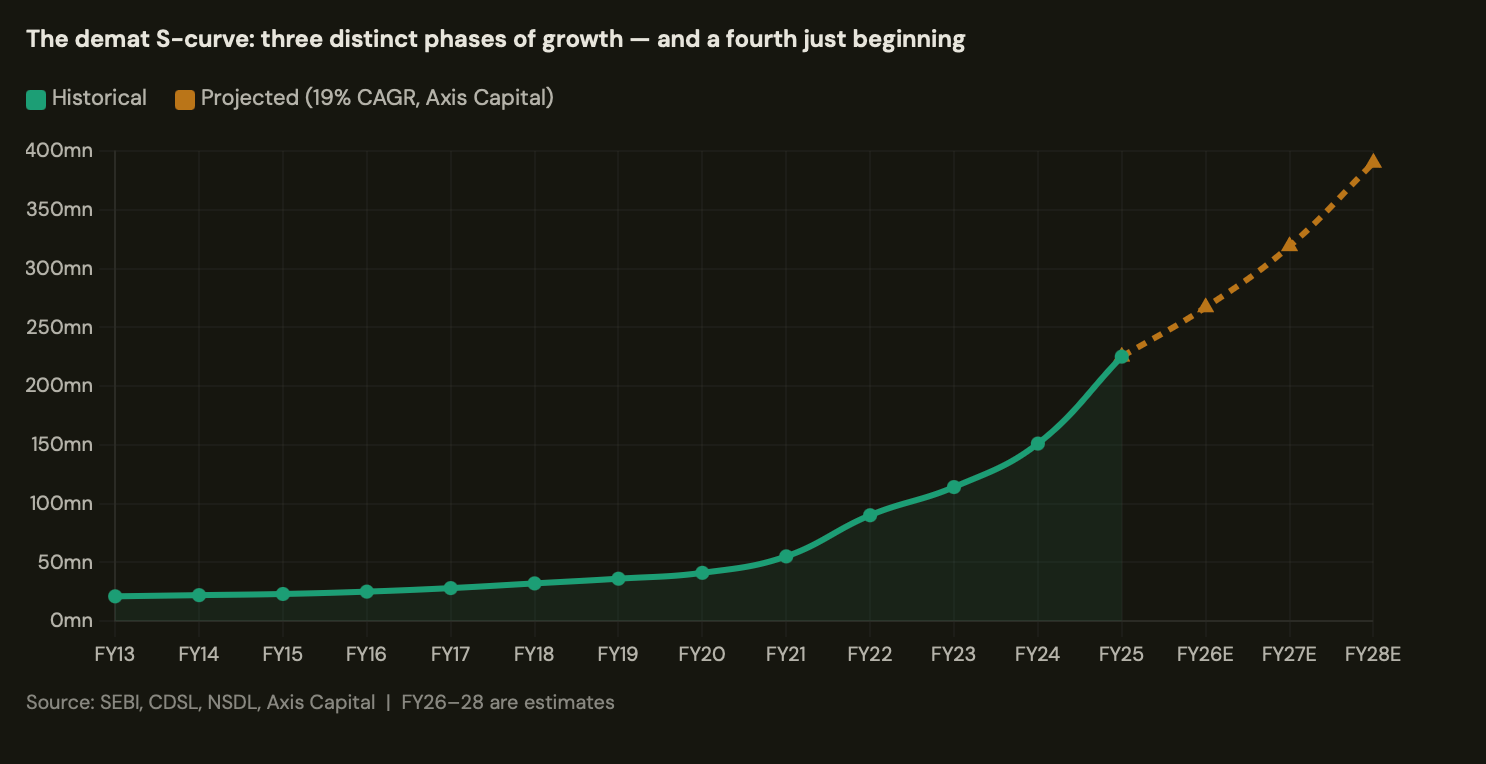
225 million demat accounts sounds like a lot. For context: India’s population is 1.4 billion. That’s 13.4% penetration. The US equivalent is approximately 60%. China is around 20%.
The demat S-curve: three distinct phases of growth — and a fourth just beginning
The three phases visible in the S-curve chart are worth narrating. Phase 1 (FY13–FY19): slow, traditional-broker-led growth. Demat was mostly an urban, upper-income phenomenon. Phase 2 (FY20–FY22): the digital onboarding revolution, enabled by Aadhaar e-KYC and discount brokers. Account openings exploded post-COVID as retail investors poured into a rising market. Phase 3 (FY23–present): normalization. Growth has moderated as the initial surge cooled and weaker markets in FY24–25 reduced the incentive for new entrants.
Phase 4 — the one the market isn’t fully pricing — is the Tier 2/3 city penetration wave. In ground-level fintech and MFI credit data, I see early indicators of digital financial product adoption in semi-urban and rural geographies that haven’t yet shown up in demat statistics. The structural enablers are in place: Jan Dhan accounts, UPI ubiquity, cheaper smartphones. The demat account on a ₹8,000 phone in Nashik is coming. Axis Capital’s 19% CAGR forecast for FY26–28E may be capturing the recovery from FY25/26 normalization — but it likely understates the Tier 2/3 wave when it hits.
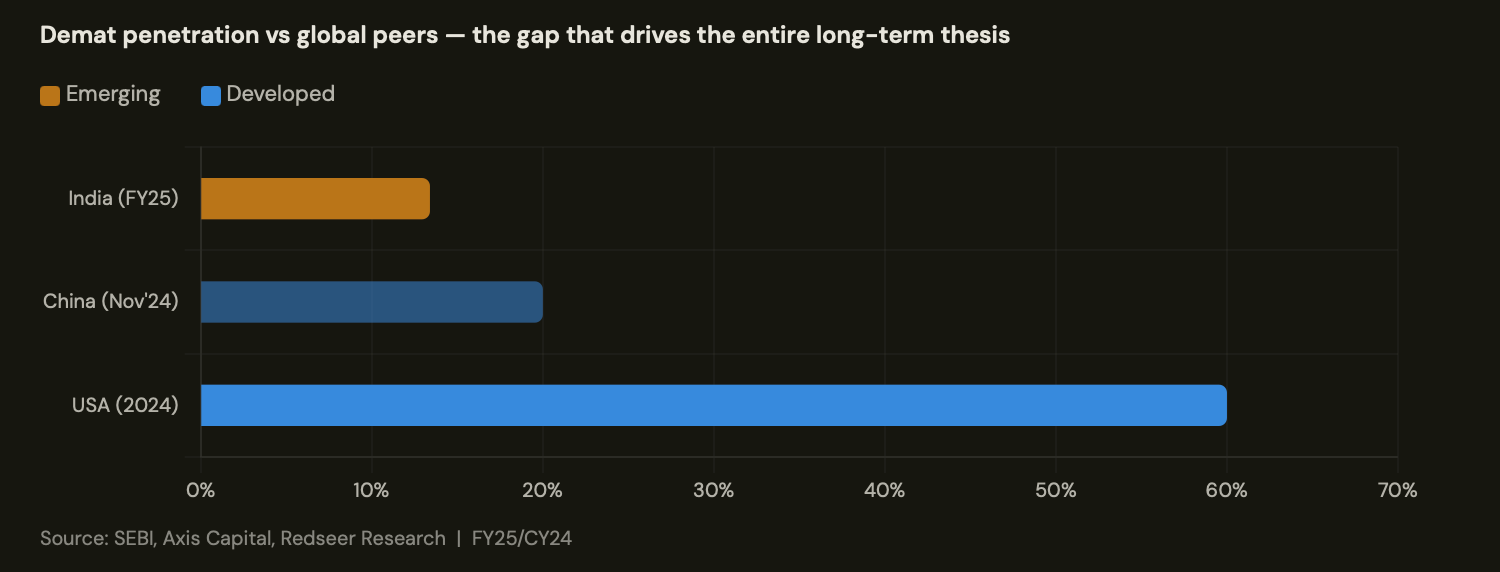
“India’s 13.4% demat penetration is not a mature market slowing down. It is an early-stage market recovering from a sugar rush — with a far larger structural shift still ahead.”
The mutual fund engine: AUM growth and why the SIP is the real story
For CAMS and KFin — the RTAs — the relevant variable isn’t demat accounts. It’s mutual fund AUM. And the MF story is equally compelling.
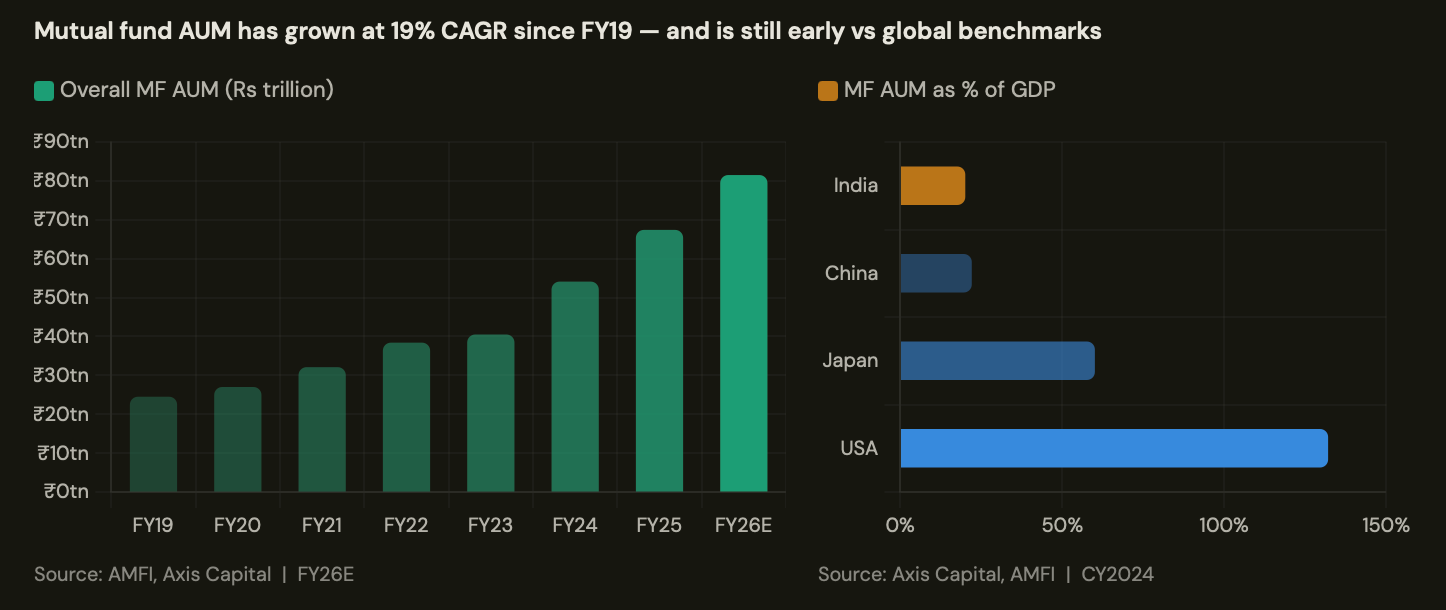
Mutual fund AUM has grown at 19% CAGR since FY19 — and is still early vs global benchmarks
India’s MF AUM has grown from Rs24.5tn in FY19 to Rs81.5tn as of FY26 — a 19% CAGR. That sounds impressive until you compare the penetration ratio : India’s MF AUM as a percentage of GDP stands at approximately 20%. Japan is at 60%. The United States is at 132%.
This comparison is sometimes dismissed as unfair — the US is the world’s deepest capital market. Fair point. But even China — also an emerging market with a partially controlled financial system — is at approximately 22% AUM-to-GDP. India, despite its sophisticated financial infrastructure, is roughly at China’s level. The structural headroom is not small. It is generational.
The SIP machine: annual contributions growing at 21% CAGR — India’s financial EMI discipline at scale
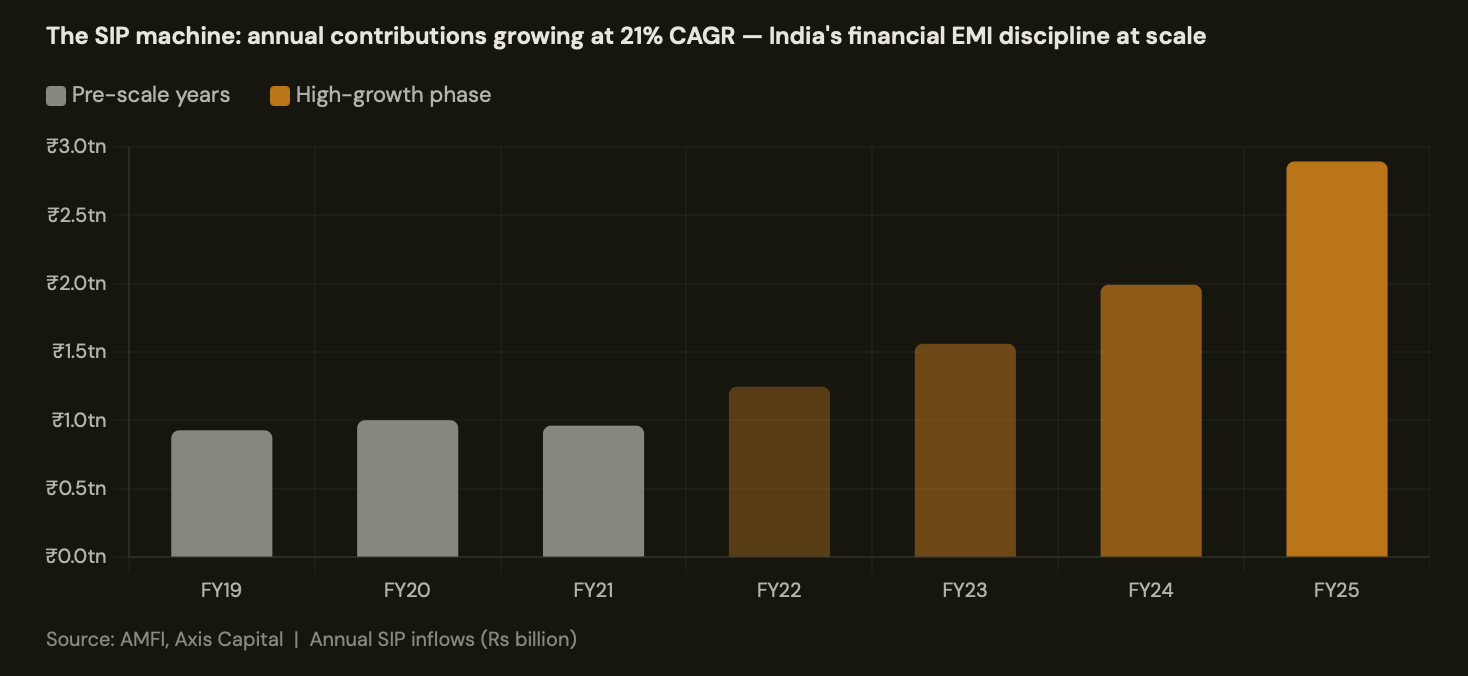
The SIP trajectory deserves more analytical attention than it usually gets.
Total SIP contributions have grown from Rs 927bn in FY19 to Rs 2,894bn in FY25 — 21% CAGR, with a current monthly run-rate of approximately Rs 289bn.
But the more interesting dimension is behavioural.
I think about SIP through the lens of consumer credit behaviour. When a borrower commits to an EMI, the psychological framing shifts: it’s no longer “how much can I invest?” it’s “I have a financial obligation I’ve already mentally accounted for.” Default and cancellation rates on committed EMIs are structurally lower than on one-off decisions. The same mechanism operates with SIPs — the investor has set up an auto-debit and mentally categorised the outflow as a recurring obligation. This is why SIP continuity held up through FY20 and FY23 market downturns: the base was trained to hold.
For CAMS and KFin, every rupee of SIP inflow is a recurring AUM unit that generates a fee every month for as long as it stays invested. The stickiness of this revenue stream is qualitatively different from transaction-based exchange revenues — and it’s the primary reason RTAs trade at a structural premium to volatility-exposed businesses.
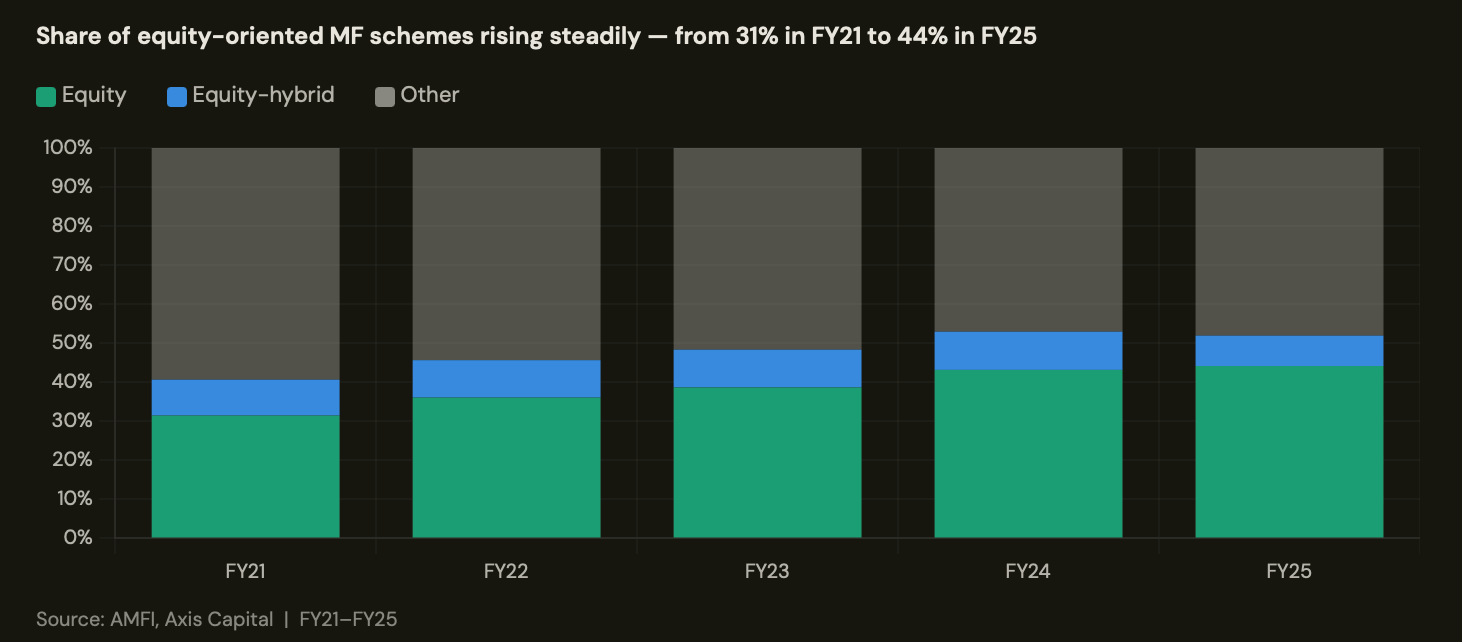
Share of equity-oriented MF schemes rising steadily — from 31% in FY21 to 44% in FY25
One more dimension to the MF story that most coverage misses: it’s not just AUM growing — the quality of that AUM is shifting.
Equity-oriented schemes have grown from 31% of total MF AUM in FY21 to 44% in FY25. Equity AUM earns higher management fees and generates higher RTA transaction fees than debt or liquid funds. The revenue-per-rupee of AUM is improving structurally, independent of absolute AUM growth.
Why “market play” is the wrong frame
I want to make one argument carefully before closing this first post, because it changes how you should think about valuation and risk.
A “market play” is a stock that goes up when the market goes up. That’s how mostly CDSL, NSDL, CAMS, KFin are described. It’s not wrong. But I feel it’s incomplete in a way that matters.
Another frame can be : structural infrastructure on a compulsory highway, with a toll that is set either by regulation or by B2B negotiation. The key word is compulsory. Whether Indian equity markets are up or down in a given year, the demat custodial fee still accrues. The SIP still processes. The IPO issuer still needs to be onboarded. The revenue is anchored to the stock of financial activity (AUM, account base, issuer count), not just the flow (trading volume, new account openings).
This creates a fundamentally different risk profile than an exchange, a broker, or an AMC. It also creates a different valuation framework — which we’ll get into in Post 4 when we look at the numbers and the global peer comparison.
But the starting point for any valuation conversation is the structural context. And the structural context is: India is a 13.4% demat penetration market that is heading toward 30-40% over the next decade, with MF AUM at 20% of GDP heading toward 40-60%, powered by a SIP base that is growing at 21% annually and reaching deeper into Indian households every year. Every single rupee of that journey flows through one of these four pipes.
WHAT THIS SERIES WON’T DO
I won’t and can’t give you a neat “BUY CDSL, SELL NSDL” conclusion in Post 1. The thesis needs the full picture. Post 2 will give you the internal mechanics of the depository business — including the unit economics (it’s Rs100 of revenue per retail investor per year, and I’ll try to show you exactly how) and the regulatory risks that 50x P/E doesn’t price. Post 3 will make the case for RTAs over depositories at current valuations. Post 4 will give the verdict with numbers.
Starting with the Map, Not Stocks
CDSL went up 5x in three years, so it must be a great business. Now it’s corrected 30%, so it must be cheap.
That’s not analysis. That’s anchoring. The right starting point is always the structural reality — what is the business, what drives its value, what are the conditions under which it can compound for the next decade. Everything else — valuation, entry price, regulatory risk — is a secondary filter applied to that primary understanding.
That is what this first post is. The map. The structural reality. India’s financial system is in the early stages of a generational transformation. Four companies sit at the only chokepoints through which that transformation must pass. Understanding why they sit there, and what they earn for it, is the foundation for everything that follows.
Post 2 publishes during next week: The Two Vaults — CDSL vs NSDL, the split-screen that defines Indian depositories, and the regulatory risk embedded in 50x P/E that most models aren’t capturing.
Thanks for reading till here. If you found this useful, you might enjoy some of my other posts exploring markets, personal finance, and investor behavior.