The data is uncomfortable. The valuation math is clear. Here’s what every SIP investor needs to understand right now.
You invest every month. You don’t look at it. Compounding does the work. Twenty years later, you retire wealthy.
It’s a beautiful story. It’s also incomplete — and right now, dangerously so.
The SIP habit is structurally sound. The entry environment matters enormously. And the current entry environment, measured across every serious valuation metric available, is one of the most expensive in India’s modern market history.
This piece is not about panic. It’s about awareness. Because the biggest risk to a long-term investor isn’t volatility — it’s staying on autopilot when the instruments are giving us a clear warning.
Let me show you the data.
Part 1 — The Return Numbers Nobody Is Talking About
Let’s start with what’s actually happening to SIP investors right now.
NSE500 SIP IRR as of March 2026:
1 Year: -12%
2 Years: -4%
3 Years: +4%
5 Years: +9%
10 Years: +14%
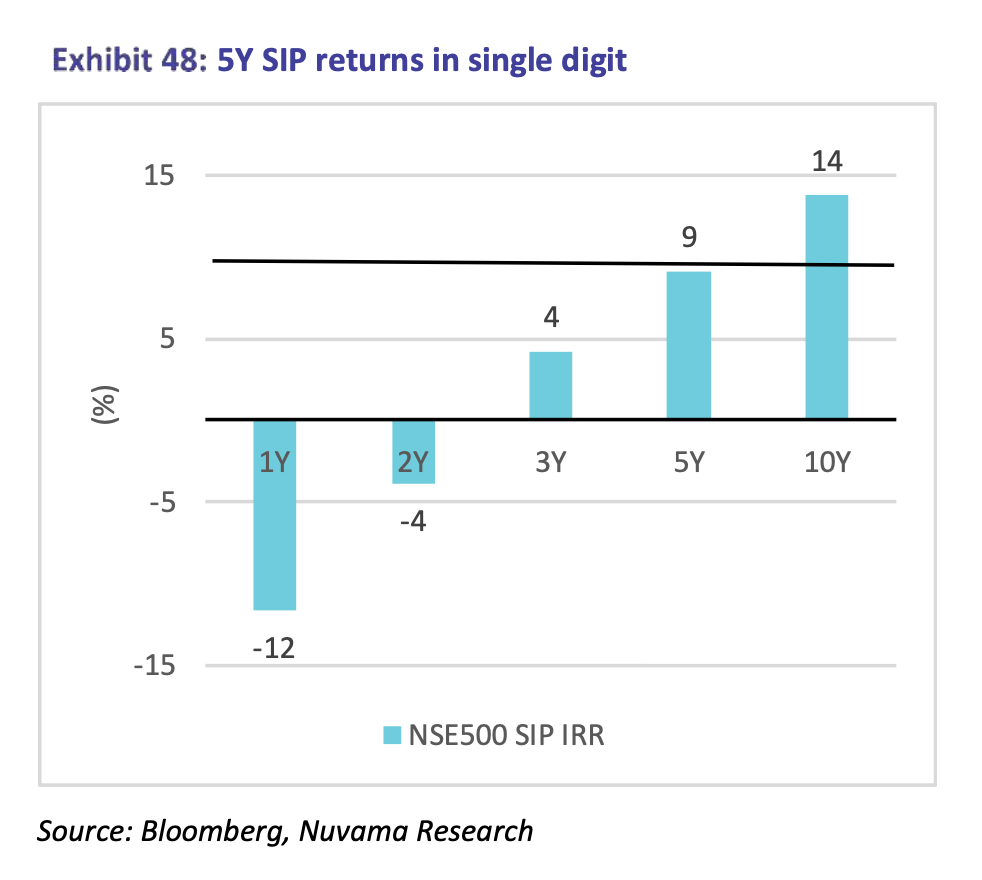
Read that again. The investor who started three years ago has earned 4% annually. The investor who started one year ago has lost 12%.
Meanwhile, bank fixed deposits offered 7–7.5% for most of this period. With no volatility. No monthly anxiety. No portfolio app to check. (Doesn’t here mean that one shall shift to FD’s)
The equity risk premium — the extra return one demands for tolerating market risk — has essentially disappeared for anyone with less than a 7-year horizon in this cycle.
This is not a permanent statement about equity investing. It is a precise statement about what happens when one enters an expensive market and it spends years going nowhere rather than correcting sharply.
Part 2 — Why the Market Is Expensive (And Still Is)
The instinctive response to weak SIP returns is “the market fell, it’ll recover.” That framing assumes the market fell far enough to become cheap. It hasn’t.
Metric 1: Nifty PE Ratio
The Nifty currently trades at 18x one-year forward earnings. Its 20-year long-term average is 16–17x. So after two full years of flat to negative returns, we are still above historical fair value — on earnings estimates that Nuvama’s institutional research team believes will themselves be cut.
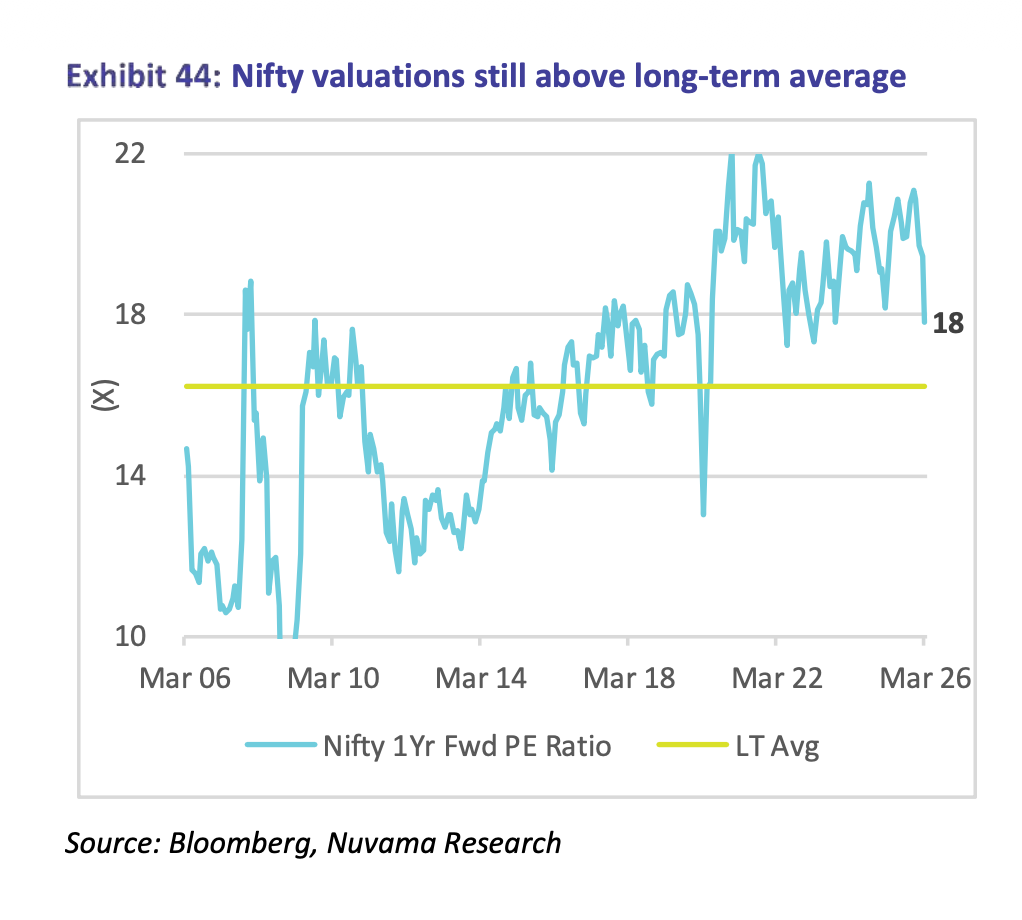
This is the double trap. Valuations are elevated. And the “E” in the PE ratio is likely going to shrink — not grow — as global headwinds hit India’s export sectors and oil prices pressure margins.
Metric 2: Market Cap to GDP
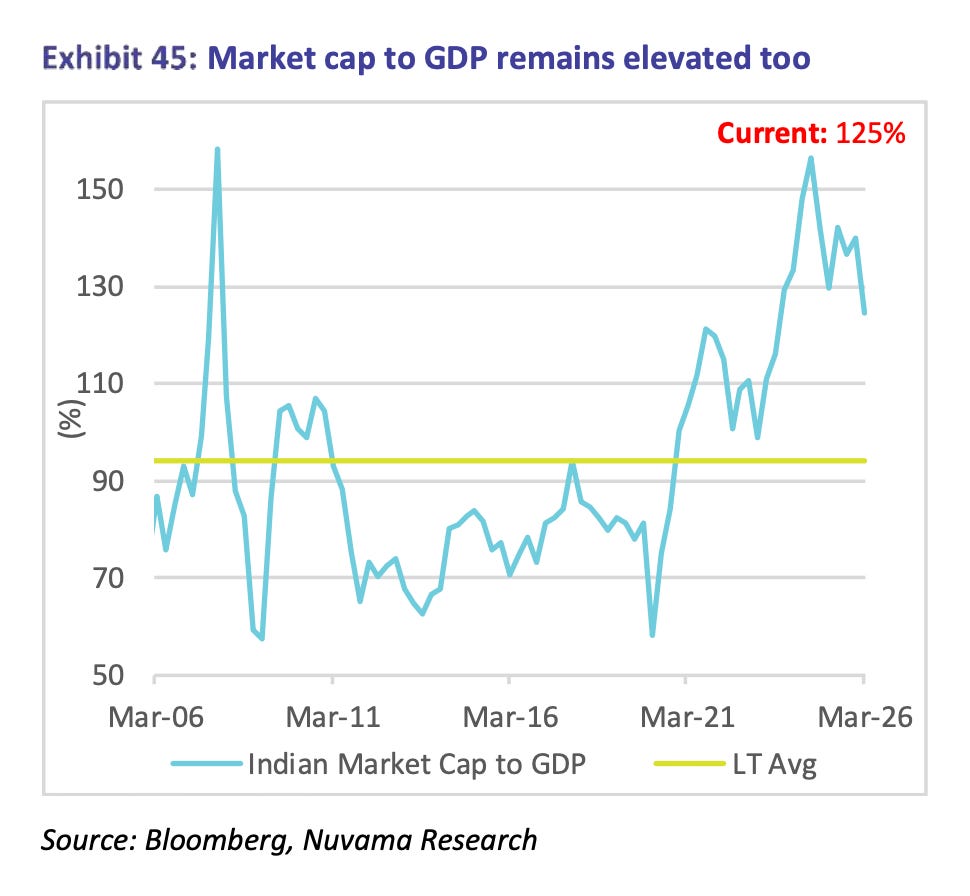
Warren Buffett’s favourite macro valuation gauge. India’s market cap to GDP currently sits at 125%. Every meaningful market bottom in India’s history has corresponded with this number in the 75–90% range. At 125%, we’re not even close to that territory.
Metric 3: Earnings Yield vs Bond Yields
This is the most sophisticated of the three — and arguably the most damning.
Earnings yield is simply the inverse of PE — it tells what “return” I’m getting from equities as if they were a bond. When I compare that to actual bond yields (India 10Y + US 10Y averaged), I get a spread that tells me whether equities are cheap or expensive relative to fixed income.
Currently, that spread is in negative territory and pointing toward “more downside ahead” — the same zone it occupied before prior periods of weak equity returns.
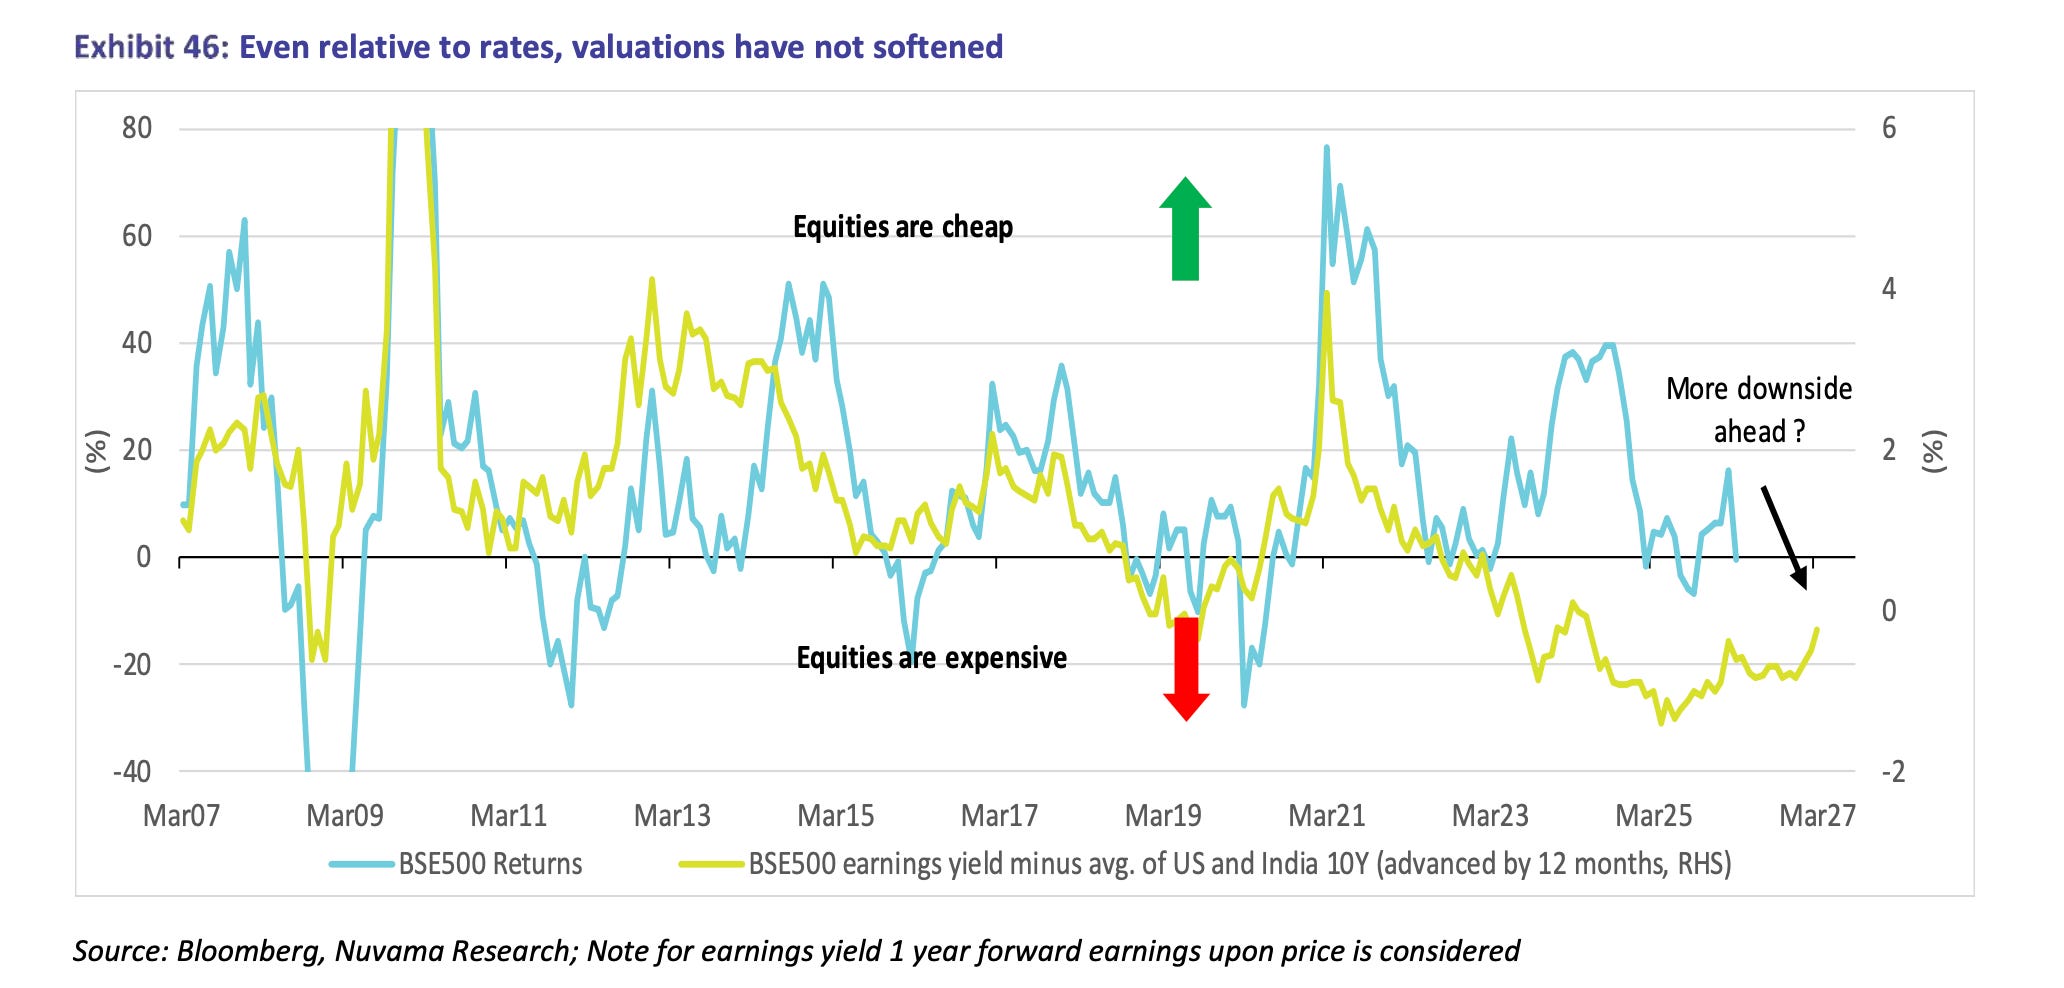
Three different metrics. Three different methodologies. Same answer.
The market is not cheap.
Part 3 — The Earnings Problem Underneath
Here is something most SIP investors don’t know: India’s corporate earnings recovery since covid has been driven almost entirely by margin expansion — not by demand growth.
Companies didn’t sell dramatically more. They made more per unit sold, as commodity costs fell and competitive intensity was low. That is a late-cycle phenomenon. It mean-reverts.
And it is now being hit from both sides simultaneously:
From above: Oil prices rising sharply due to geopolitical supply shock, compressing input cost advantages
From below: Competitive intensity rising across FMCG, paints, NBFCs, durables and retail as new entrants erode incumbents
The consensus currently expects BSE500 PAT growth of 19% for FY27. FII’s currently thinks this will be cut — significantly. History suggests consensus earnings estimates at this stage of the cycle are almost always too optimistic.
If earnings get cut while valuations are already elevated, the PE ratio doesn’t just stay high — it re-rates upward even as the market stays flat. That’s how we get two more years of going nowhere.
Part 4 — The Recovery Is Narrower Than It Looks
The H2FY26 recovery in India is real. But look under the hood and it’s almost entirely driven by GST cuts — not genuine demand revival.
Sectors that got GST cuts are showing traction. Everything else is weak.
Autos: Strong ✓ | Real Estate: Weak ✗
Cement volumes: Perking up ✓ | Steel demand: Sluggish ✗
Tractor sales: Strong ✓ | Agrochemical revenues: Weak ✗
MHCV sales: Recovering ✓ | Diesel consumption: Weak ✗
This divergence is historically anomalous. The sectors that are strong are strong because of a one-time policy impulse — not because underlying income growth and demand momentum have genuinely recovered. When the GST cut effect fades, so does the divergence. In the current global environment, the risk is that the weak sectors drag down the strong ones — not that the strong sectors pull up the weak.
Part 5 — The Flow Risk Nobody Is Watching
Here is the systemic risk that sits beneath all of this.
Indian equity markets over the last three years have been stabilised by one force above all others: domestic retail flows through SIPs. When FIIs sold, DIIs bought. The market held. The narrative of “India decoupling” was really a narrative of domestic flows overwhelming foreign selling.
That cushion is now softening.
Apr–Feb FY26 equity inflows are down 11% year-on-year. Not collapsed — but softening. And the mechanism for a sharper softening is already in place: when SIP investors see -12% on 1 year and -4% on 2 years, the marginal investor pauses. The next marginal investor doesn’t start. Monthly SIP amounts grow slower. The flow cushion thins.
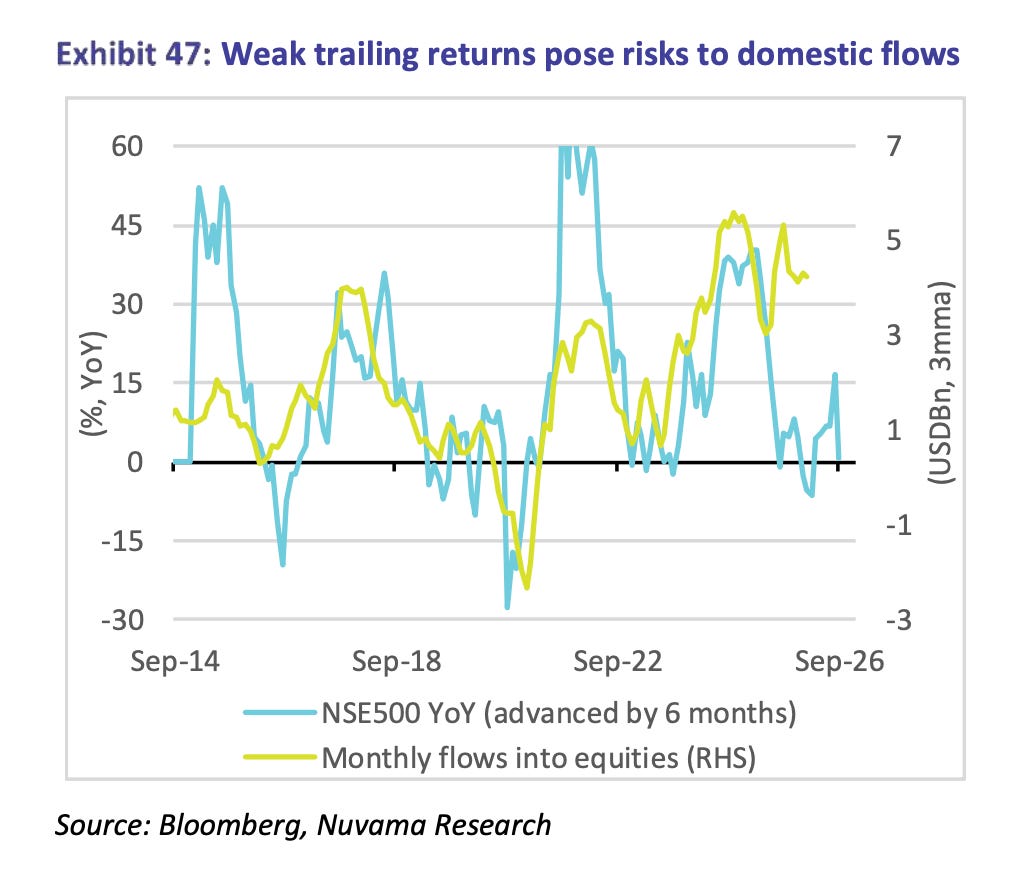
Historically, sustained periods of weak trailing returns combined with income pressure have preceded sharp moderation in equity inflows. We are at the beginning of that window — not the end.
If flows slow meaningfully, the one structural support that has held Indian markets up disappears. That is when valuation gravity reasserts itself fully.
Part 6 — What am I doing ?
Uncertainty.
What the data clearly says:
The market is expensive.
Earnings are at risk.
The global environment is the most uncertain it has been since 2020.
The domestic recovery is narrower than headlines suggest.
The SIP cushion is thinning.
This is not a “buy everything” moment.
What the data does NOT say:
It does not say crash is imminent. Markets can stay expensive for longer than any analyst expects. The RBI still has rate-cutting runway. A global Fed liquidity injection could change the calculus quickly. Oil supply normalisation from the war would meaningfully reduce margin pressure.
The practical framework for a thinking SIP investor:
First — I am not stopping my SIPs. The 10-year IRR of 14% is real. The habit is correct. Compounding works. But compounding works even better when you’re slightly more deliberate about where it goes. I’m a unit collector and currently just collecting more units then I was, 2 years back.
Second — not all of the market is equally expensive. Roughly 36% of BSE500 market cap is in sectors facing structural micro challenges (IT, FMCG, NBFCs, Durables, Paints). Another 41% is in expensive cyclicals at peak margins (Autos, Metals, PSU Banks, Power, Industrials). That’s 77% of the market with serious headwinds. The remaining 23% — private banks, insurance, select energy, chemicals — is where valuations have begun to reflect reality.
Third — if doing index SIPs, that’s fine for the long run. But if doing active stock or fund selection, this is a moment to think about whether the portfolio has exposure to the 77% or the 23%.
Fourth — can increase one’s reading. Not CNBC. Not Twitter. Books by Lynch, Munger, on valuations etc. (also read my substack too, :D ). The information asymmetry between a well-read retail investor and an uninformed one has never been wider — or more consequential.
Closing
The 10-year SIP number — 14% — is real. The system works. But it works best when entered at fair or undervalued levels. It still works, but more slowly and more painfully, when entered at elevated valuations.
We are in the second scenario right now.Views expressed are for educational and informational purposes only. This is not investment advice. Please consult your financial advisor before making investment decisions.
If you found this useful, consider sharing it with someone who is on SIP autopilot right now. They’ll thank you later.