I wrote this after studying a sharp framework that challenged a popular belief (earlier I and) many investors currently hold—that two years of flat markets automatically means valuations are now reasonable. The reality is more nuanced. Beneath the headline index, large parts of the market may still be expensive, structurally challenged, or late in the cycle.
This piece breaks down a simple but powerful “three bucket” framework that can help investors audit portfolios more intelligently, identify where risks are concentrated, and think more clearly about where fresh capital should go next.
Markets have been flat for two years. Valuations have corrected. Policy easing is underway. The worst is behind us. Time to get back in.
It’s a seductive narrative. It has just enough truth to be dangerous.
The markets have indeed been flat for two years. Policy has eased. RBI has cut rates. GST reductions have stimulated pockets of demand.
But here is what that narrative misses completely: flat returns from elevated valuations are not the same as a correction.
A genuine correction brings prices to fair value — or below. Flat returns from high starting valuations just means time has passed while earnings slowly catch up — or while the risk quietly accumulates.
The Nifty is still trading at 18x one-year forward earnings. Its 20-year average is 16–17x. Market cap to GDP is still at 125%. Every serious valuation metric says the same thing: we have not corrected to fair value.
But the aggregate valuation number is only part of the story. The more important question — and the one that most Indian investors never ask — is what sits underneath that number.
In this piece, I want to write about the framework that answers that question precisely.
The Framework — Three Buckets
Nuvama Institutional Equities, in their March 2026 strategy report, published a disaggregation of BSE500 market cap that is the most useful portfolio construction tool I have seen from any Indian research house in recent years.
Instead of the conventional sector-by-sector breakdown, they split the market into three categories based on the nature of the risk each sector faces.
The result is striking.
36% of BSE500 market cap — Micro-challenged sectors
41% of BSE500 market cap — Expensive cyclicals with macro risk
23% of BSE500 market cap — Others (the opportunity set)
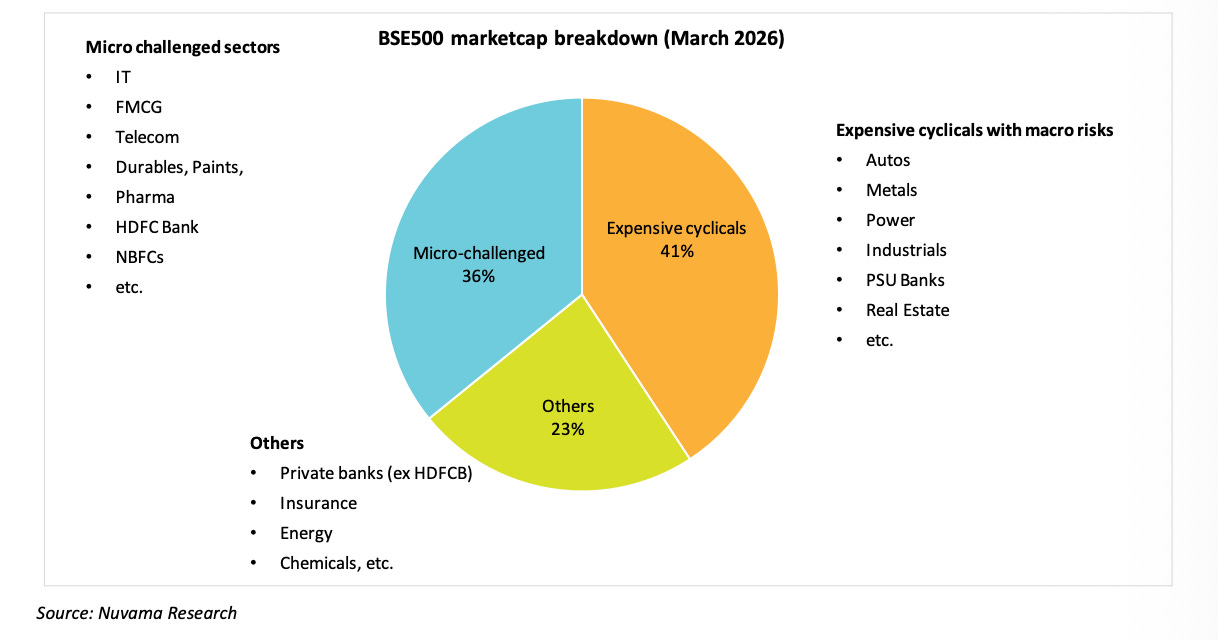
That means 77% of India’s benchmark index has a serious, identifiable problem — either structural disruption at the business level, or expensive valuations at a point in the cycle when macro risk is highest.
Let me take write through here each bucket in detail. Because understanding which bucket your portfolio sits in is the most important portfolio audit you can do right now.
Bucket 1 — The Micro-Challenged Sectors (36%)
These are the sectors that built India’s quality investing culture.
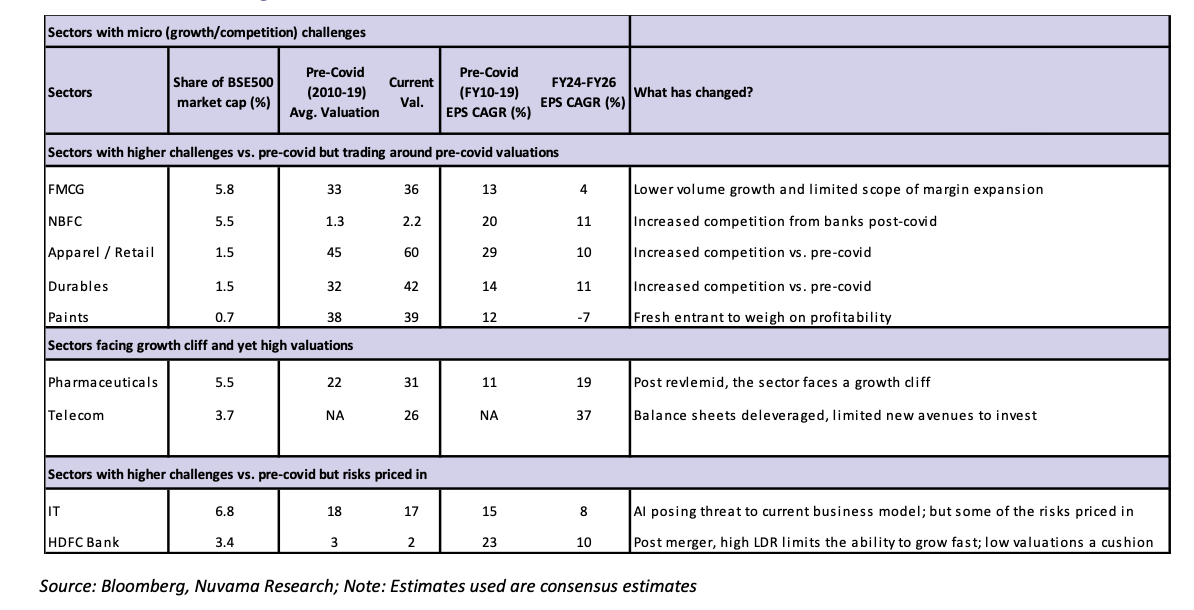
FMCG companies that compounded at 13% for a decade. IT majors that delivered dollar revenue growth through every cycle. NBFCs that grew loan books at 20%+ while maintaining low NPAs. Consumer durable companies that rode India’s premiumisation wave. Paint companies that enjoyed near-duopoly economics.
These were the bedrock of every SIP-based long-term equity portfolio. And they still trade at or above their pre-covid valuation averages — because the memory of their quality is priced in, even as the quality itself has structurally changed.
FMCG — The Volume Growth Problem
FMCG valuations sit at 36x — above the pre-covid average of 33x. Yet EPS CAGR has fallen from 13% in the pre-covid decade to just 4% in FY24–26.
The structural shift is real. Quick commerce platforms have reduced the distribution moat that FMCG companies built over decades. D2C brands have attacked premium segments. Private labels from large retailers are eating into mass segments. And rural demand — the engine of volume growth for most of the 2010s — has not recovered meaningfully.
The market is paying more than the pre-covid premium for a business growing at one-third the pre-covid rate.
NBFCs — The Bank Competition Problem
Post-covid, commercial banks — flush with capital and under pressure to grow — aggressively entered MSME and retail lending, the traditional bread and butter of NBFCs. This compressed spreads and market share simultaneously.
NBFC EPS growth has halved vs pre-covid levels. Yet P/B valuations have risen from 1.3x to 2.2x. The market is paying a higher multiple for a structurally weaker business.
Paints — The New Entrant Problem
Berger, Asian Paints, Kansai Nerolac — for two decades, Indian paints was one of the most enviable oligopolies in the consumer space. High margins, strong distribution, low competitive intensity.
Then Birla Opus arrived. Backed by Aditya Birla Group’s balance sheet and distribution network, it has fundamentally altered the competitive calculus. Margins are under structural pressure. Valuations have not adjusted to reflect the new reality — paints currently trades at 39x vs a pre-covid average of 38x. Essentially unchanged, despite the landscape having changed materially.
IT — The AI Disruption Question
Indian IT deserves a longer treatment than I can give it here — but the short version is this.
AI tools are reducing the demand for the outsourced headcount model that Indian IT was built on. Not eliminating it — reducing it. The question is pace. If productivity per engineer doubles because of AI tools, the same revenue can be generated with fewer engineers. That is structurally deflationary for headcount-based IT services.
Valuations have partially corrected — IT now trades at a meaningful discount to Nifty with a dividend yield of 4.3%, close to its historical high. This is one of the two sectors in the micro-challenged bucket where Nuvama believes risks are at least partially priced in.
The Core Problem With Bucket 1
The trap in this bucket is subtle. When valuations “return to long-term average,” it feels like fair value has been reached. But long-term averages were established during periods of structurally better growth. When the growth rate has permanently stepped down, the historical average is not fair value — it’s a value trap wearing the costume of mean reversion.
Bucket 2 — The Expensive Cyclicals (41%)
If Bucket 1 represents the old guard under siege, Bucket 2 represents the post-covid heroes.
These are the sectors that surged when India’s capex cycle restarted, when commodity prices recovered, when PSU balance sheets were repaired and when government capital expenditure created a multiplier effect across infrastructure and industrials.
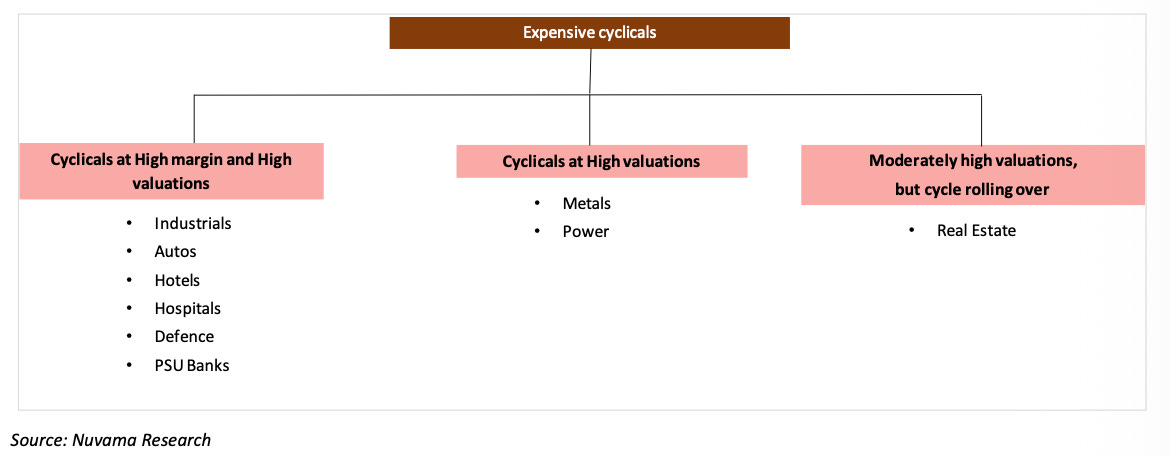
They delivered exceptional returns between 2020 and 2024. And markets rewarded them with aggressive re-rating.
The problem is where they now sit in their own cycle.
The Late-Cycle Setup
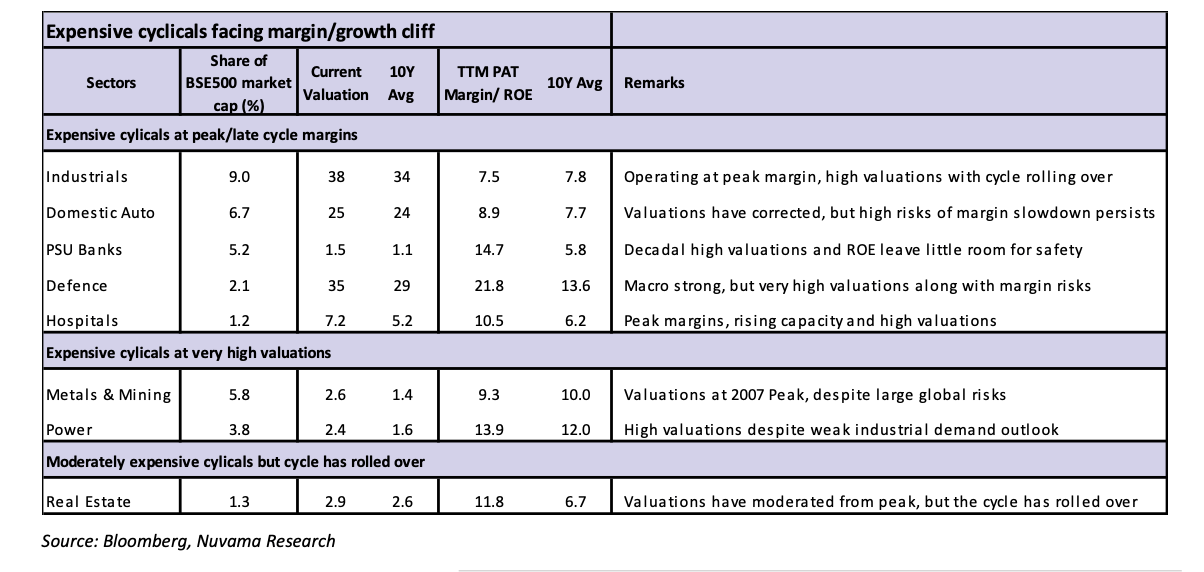
Industrials currently trade at 38x — above the 10-year average of 34x. PAT margins are at 7.5% — essentially at long-term average, not elevated. But the capex cycle is showing signs of rolling over. Order books that drove 2023–24 earnings are being lapped. New order flows are moderating.
PSU Banks are the most concerning. Valuations at 1.5x P/B are close to 15-year highs. ROEs at 15% are at peak. Their loan books have aggressive exposure to households and MSMEs — precisely the segments most vulnerable to income stress and supply chain disruption from the current oil shock. The margin of safety is essentially zero.
Metals are priced on P/B at levels last seen in 2007 — near the absolute peak of the global commodity supercycle — despite ROEs that are merely at long-term average. If global growth slows — and the signals from the US labour market, private credit and AI capex suggest it might — metals face both a demand shock and a valuation de-rating simultaneously.
The Peak Margin Problem
Here is the mechanism that makes Bucket 2 particularly vulnerable.
India’s post-covid corporate earnings recovery was driven primarily by margin expansion — not demand growth. Companies reported better profits not because they sold dramatically more, but because input costs fell (commodity deflation), competitive intensity was low (many competitors had exited during the downcycle), and leverage had been repaired.
That margin expansion is now fully priced in. And it faces pressure from two sides simultaneously.
From above: Oil prices rising due to geopolitical supply shock, pushing up input costs across manufacturing, chemicals, paints, logistics and FMCG.
From below: Competitive intensity rising as the capex cycle matures and new capacity comes online across cement, steel and consumer goods.
When you are at peak margins, any deterioration goes straight to PAT. Earnings are maximally sensitive at precisely the moment valuations are maximally stretched.
Bucket 3 — The 23% That Actually Offers Value
After going through 77% of the market, we arrive at the 23% where the risk-reward is most rational.
Private Banks
This is the standout opportunity in Nuvama’s framework — and the reasoning is straightforward.
Private banks (excluding HDFC Bank which they treat separately) are sitting at 1 standard deviation cheap on P/B. ROEs are at long-term average — not peak, not trough. Some macro risk is priced in.
And the competitive dynamic is shifting in their favour: PSU banks, having been aggressive in retail and MSME lending, may pull back as credit quality pressures emerge, reducing competitive intensity for private banks.
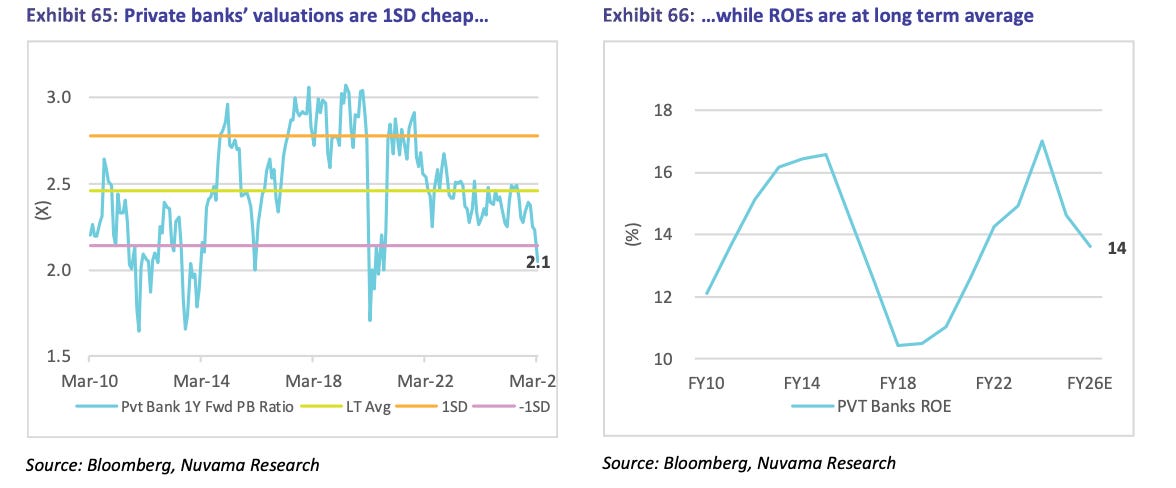
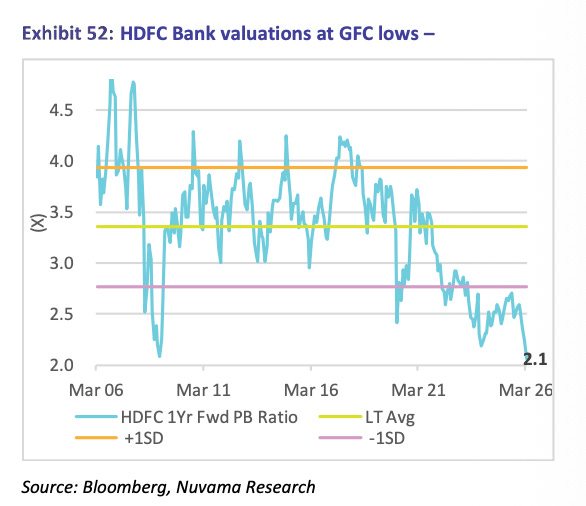
HDFC Bank warrants specific mention. Post-merger, it is navigating a loan-to-deposit ratio mismatch that is temporarily compressing margins and depressing ROE. The market has punished it accordingly — P/B at 2.1x, near GFC-era lows, well below its long-term average of 3x.
The view, which I find compelling: this is a transition, not a structural break. The LDR mismatch will normalise over 2–3 years. And at GFC-era valuations, a significant amount of pain is already priced in for a bank that is structurally far stronger than it was in 2008.
Insurance
Life insurance — particularly SBI Life — offers reasonable growth at reasonable valuations in a market where reasonable valuations are scarce. The sector is structurally underpenetrated in India. Growth drivers are secular. And P/EV valuations have come off peak levels.
Chemicals and Select Energy
Coromandel International (agri-chemicals) and Reliance Industries (energy/retail/Jio) sit in this bucket with reasonably attractive risk-rewards. Reliance’s valuation at 21.5x FY27E forward PE is not cheap — but against a 10-year average of 19.1x, the premium is modest relative to the growth drivers across its three verticals.
The Portfolio Audit
This framework has one immediate practical application which I am right away applying.
Pulling up my portfolio. For every significant equity holding — direct stocks, mutual funds, or ETFs — I’m asking myself three questions.
Question 1: Which bucket does this belong to?
Question 2: If it’s in Bucket 1 or 2 — what is my thesis for holding it at current valuations? Has that thesis been updated for the structural changes in the business or cycle?
Question 3: What percentage of my equity exposure is in Bucket 3 vs Buckets 1 and 2?
If the honest answer to Question 3 is “less than 20%,” my portfolio may be more concentrated in risk than I realise.
This is not an argument for wholesale selling. I (Long-term investor) with 5+ year horizons and diversified SIPs shall/will be fine across cycles. But it is an argument for being deliberate about where incremental capital goes — and for raising the quality bar on new additions.
The Macro Context That Makes This Urgent
The 77% problem is not just a domestic valuation story. It sits within a global macro context that amplifies every risk.
The US labour market is showing recession-like signals. AI capex — which has been masking US economic weakness — may be entering its late cycle. A $2 trillion US private credit market faces redemption pressure from AI disruption to SaaS companies. Oil prices are elevated due to a supply shock that may persist.
What I have read and understood in last 10years, India has never decoupled cleanly from global risk-off episodes. In every prior global volatility event — 2000-01, 2008, 2011, 2015-16, 2018, 2021-22 — Indian markets sold off regardless of domestic fundamentals.
When global risk-off hits an Indian market where 77% of market cap has identifiable problems — expensive cyclicals at peak margins, micro-challenged sectors at above-fair-value prices — the correction potential is larger than consensus expects.
The two safety valves — Federal Reserve liquidity injection and oil supply normalisation from geopolitical resolution — could change this calculus meaningfully. But neither is guaranteed or imminent.
Conclusion — Know Your Buckets
Two years of flat returns have created a false sense of security.
The Indian market has not corrected to fair value. It has gone sideways at expensive — waiting for earnings to catch up with prices, or for prices to fall to meet earnings.
In that environment, not all of the market is equal. The 23% that offers reasonable risk-reward is real and investable. The 77% that carries concentrated risk — structural disruption in Bucket 1, late-cycle vulnerability in Bucket 2 — deserves a much higher bar before you add to it.
Know your buckets.
Audit your exposure.
And invest the next rupee with your eyes open.
Data sourced from Nuvama Institutional Equities Strategy Report, “Tariffs, AI, War — What’s Next?”, Views are for educational and informational purposes only. Not investment advice. Consult a SEBI-registered financial advisor before making investment decisions.
If this framework was useful, share it with someone who hasn’t audited their portfolio recently. It might be the most valuable thing you do for them this month.